Migrate Physical VMs using Azure Migrate with Private Endpoints

This process is extremely complicated and not well documented, so I’m going to detail each step here to help guide you through it.

1) Preparation

Install two Windows Server 2019 VMs (Note: Windows Server 2022 isn’t compatible as a Replication Server) and join them to the domain.

VM1: AzMigrate1
VM2: AzReplicate1 – Allocate at least 700GB of drive space for replication.

Create a Resource Group called Migration-RG in Azure.

2) Create the Azure Migrate Project

Go to the Azure Migrate blade in the Azure portal.

A screenshot of a chat description automatically generated

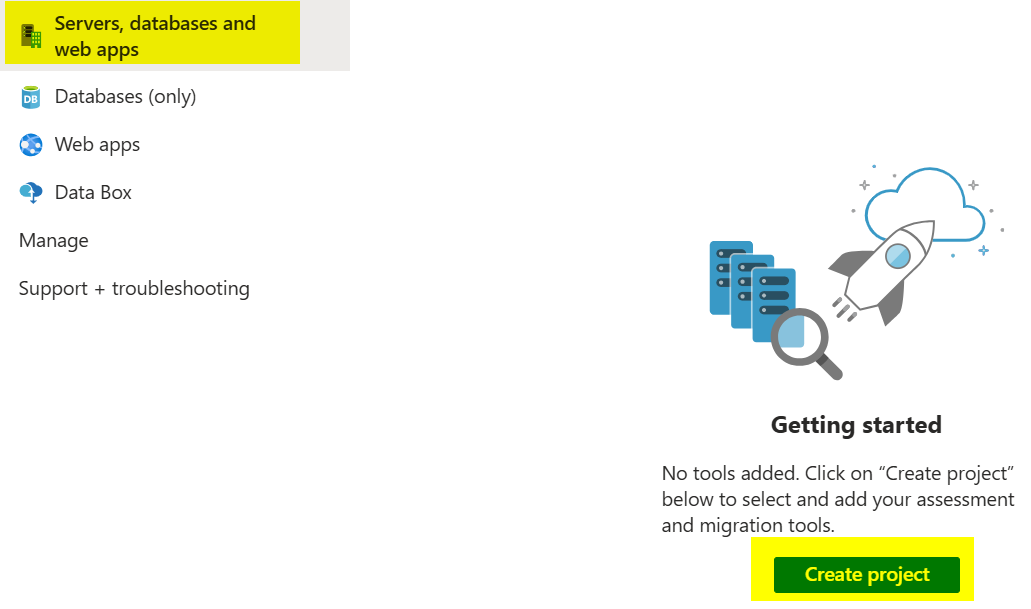
On the left-hand side, select Servers, databases and web apps, then click Create project.
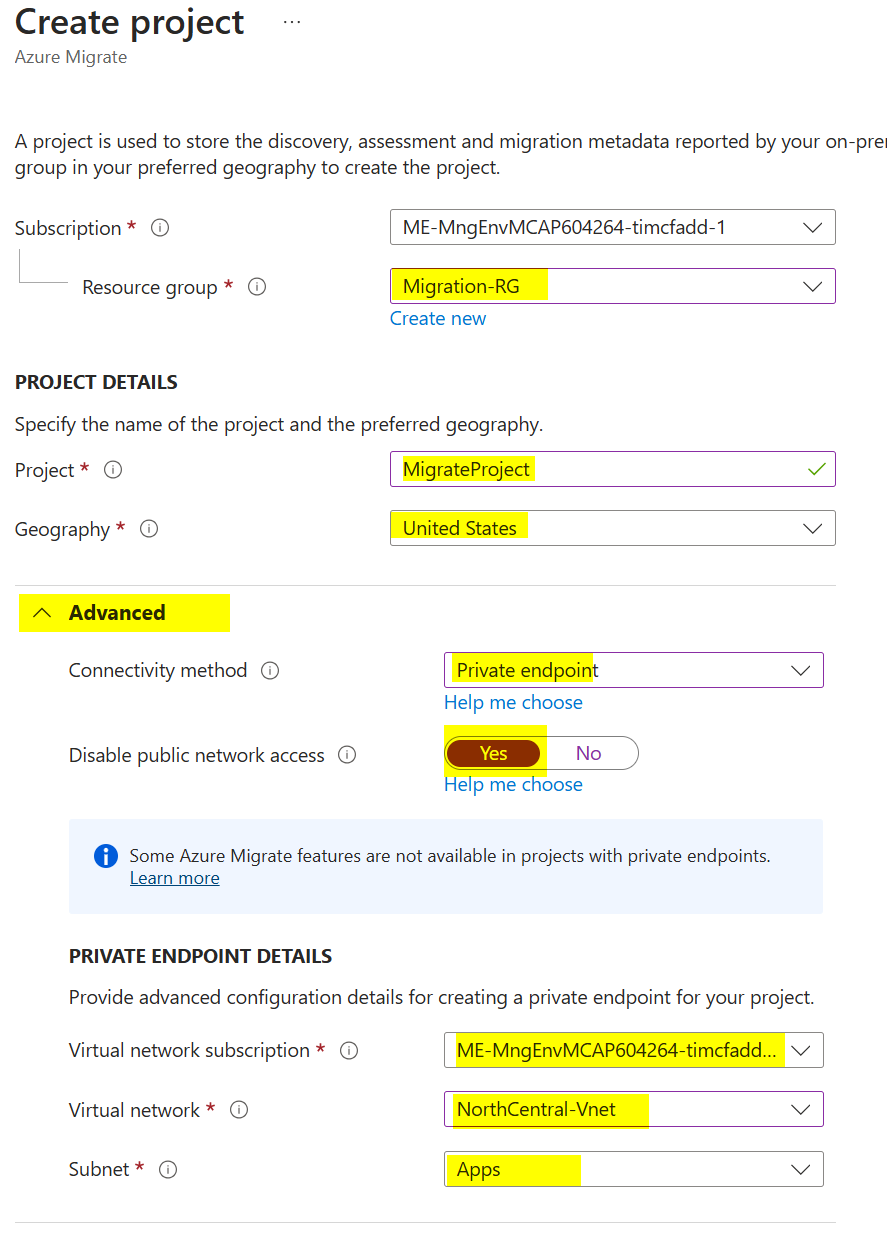
Select the Migration-RG resource group.

Give the project a name, for example MigrateProject.

Select a location, for example United States.

Click Advanced, choose Private endpoint for the connectivity method, and set Disable public network access to Yes.

Select your subscription, virtual network, and subnet.
A screenshot of a computer description automatically generated

Click Create.

3) Set Up the Azure Migrate Appliance

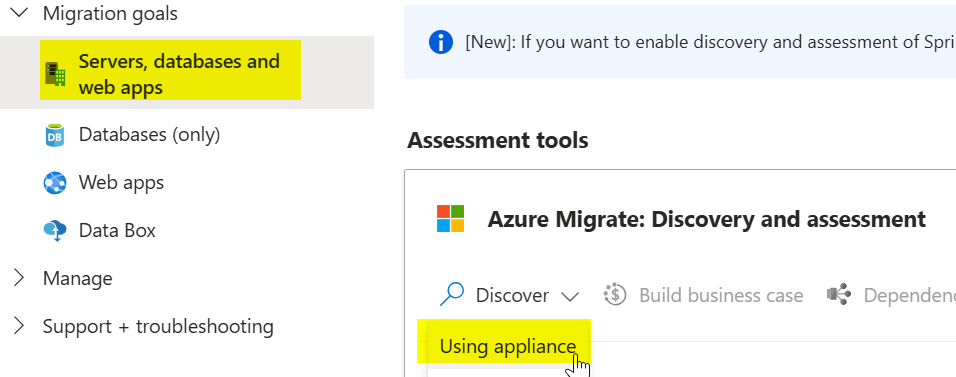
In Azure Migrate, click Servers, databases, and web apps again.

Click Discover, then select Using appliance.
A screenshot of a computer description automatically generated

Under “Are your servers virtualized?” choose Physical or other.

Under “Generate project key,” give your appliance a name (e.g. MigrateApp), then click Generate Key.

A screenshot of a computer description automatically generated

Log in to the AzMigrate1 server using RDP.

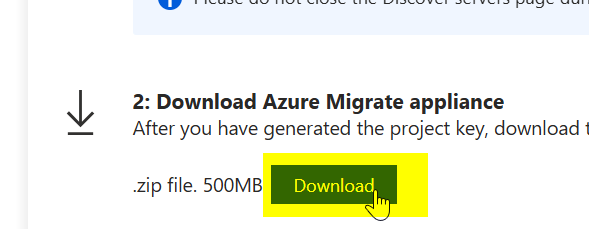
Download the Azure Migrate Appliance. Copy and extract it to the AzMigrate1 server.
A screenshot of a computer description automatically generated

Copy the project key and save it to a text file on AzMigrate1.

Important: Ensure your on-premises server can communicate with Azure Private DNS.

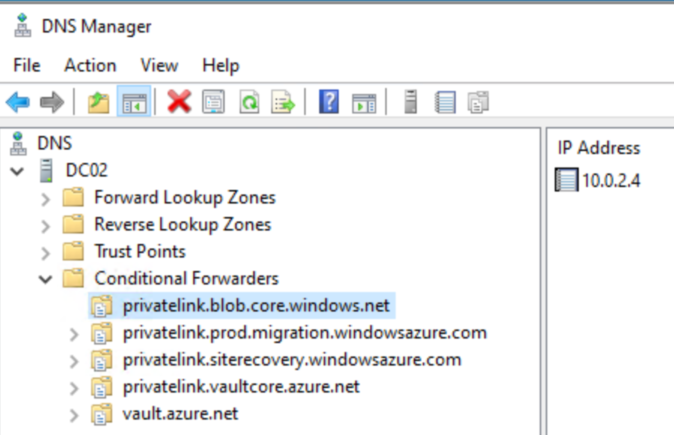
You will need conditional forwarders set up for these Private DNS zones:

privatelink.blob.core.windows.net
privatelink.prod.migration.windowsazure.com
privatelink.siterecovery.windowsazure.com
privatelink.vaultcore.azure.net

If your local DNS can’t communicate with Azure Private DNS directly, you may need a DNS server in Azure or a Private DNS resolver. With a private DNS resolver, you can set conditional forwarders there.
A screenshot of a computer description automatically generated

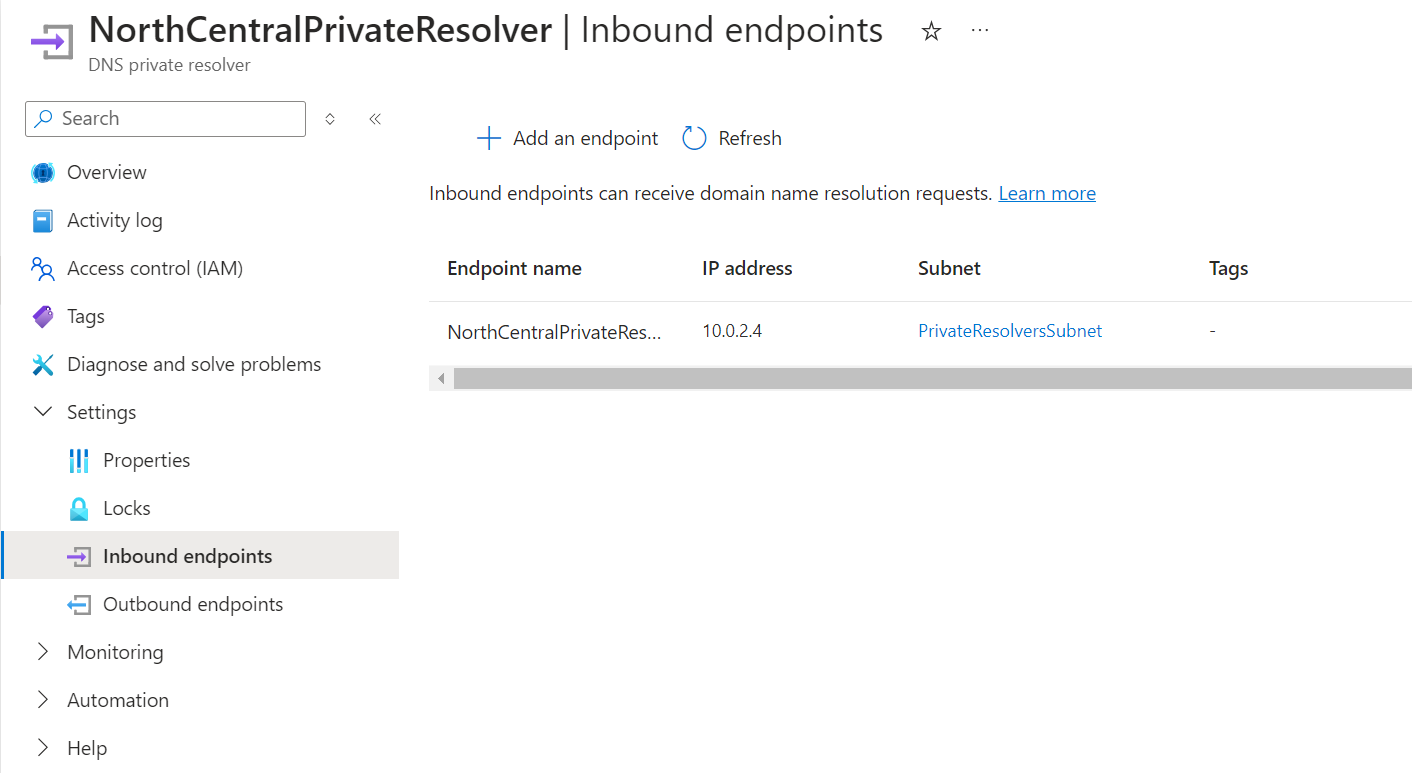
Here is how I have my private resolver set up:
A screenshot of a computer description automatically generated

If Private DNS isn’t working, you could use an LM hosts file on AzMigrate1, but it’s not recommended.

To get host files if you don’t have Private DNS working:

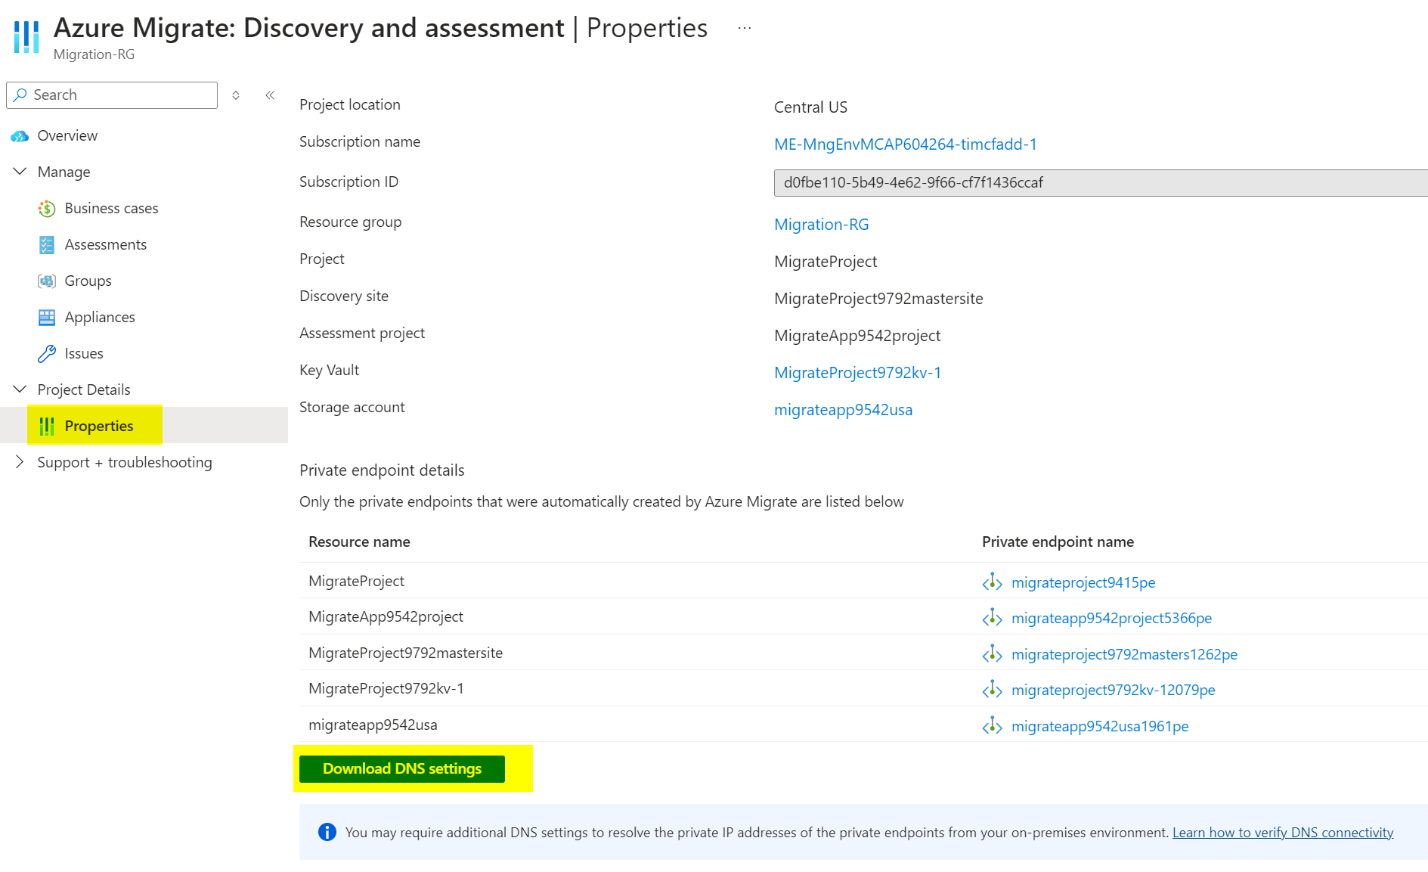
Go to the Azure Migrate project and click Overview. Under Project Details, click Properties, then select Download DNS Settings.

A screenshot of a computer description automatically generated

If you’re using a hub-and-spoke network, ensure that each private DNS zone has a virtual network link to your hub network with the site-to-site VPN. Otherwise, DNS queries won’t resolve privately.

We can verify private DNS is working by running an NSlookup from AzMigrate1 against one of the private DNS records:

A blue screen with white text description automatically generated

Once verified, proceed with the Azure Migrate Appliance installation.

On AzMigrate1, open PowerShell and navigate to the directory where the appliance files were extracted. Run:

.\AzureMigrateInstaller.ps1

A screen shot of a computer screen description automatically generated

Select 3 for Physical, 1 for Azure Public, and 2 for Private Endpoint connectivity. Press Y to continue.
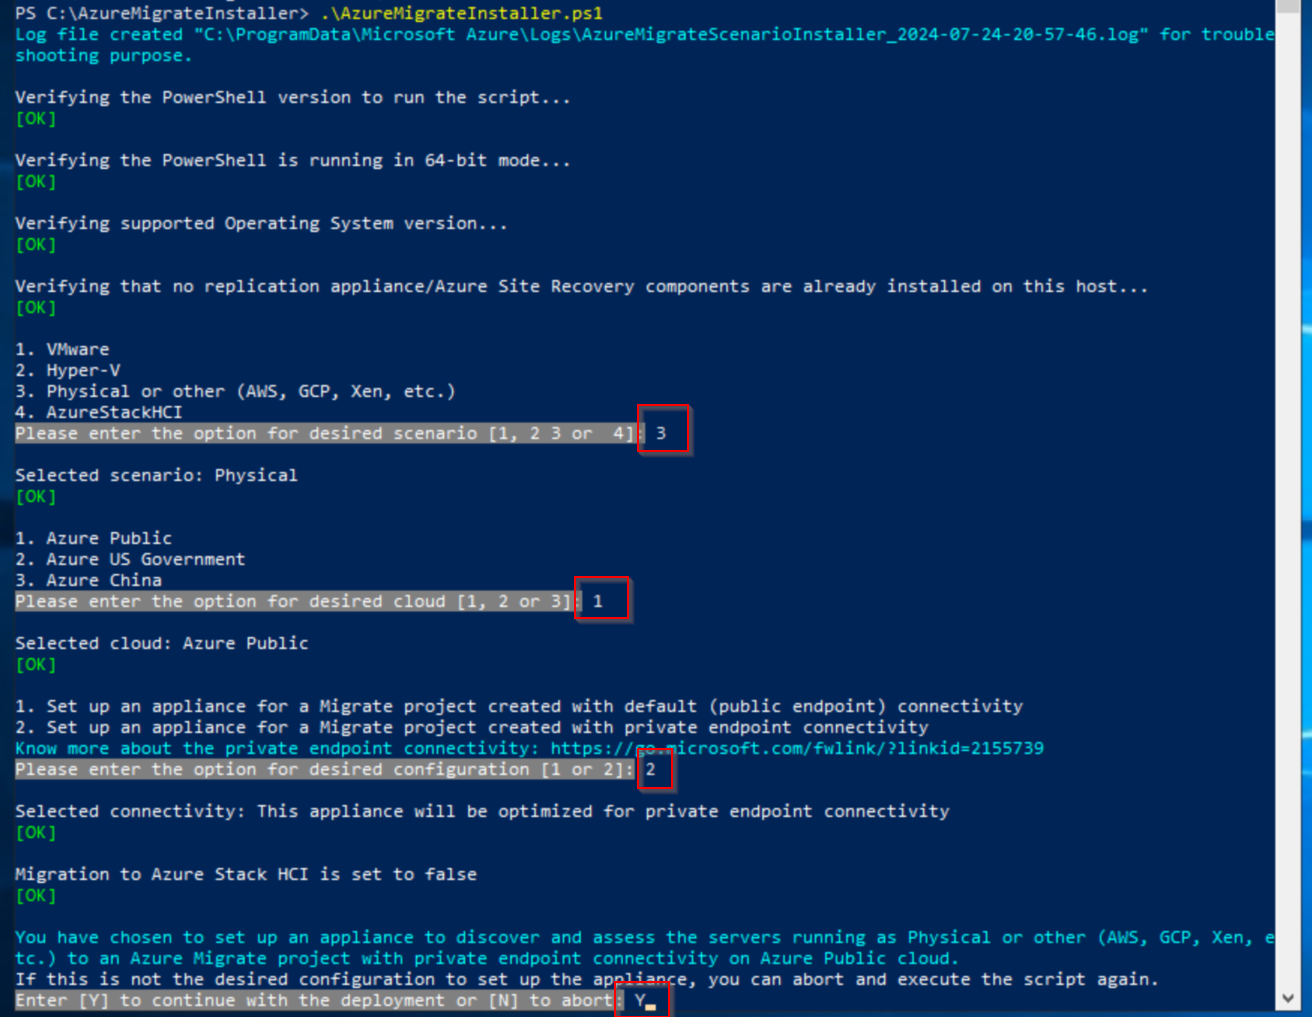
A screenshot of a computer program description automatically generated

When asked to install Microsoft Edge, select Y. If it fails, download it manually from this link. Choose to remove IE as prompted.
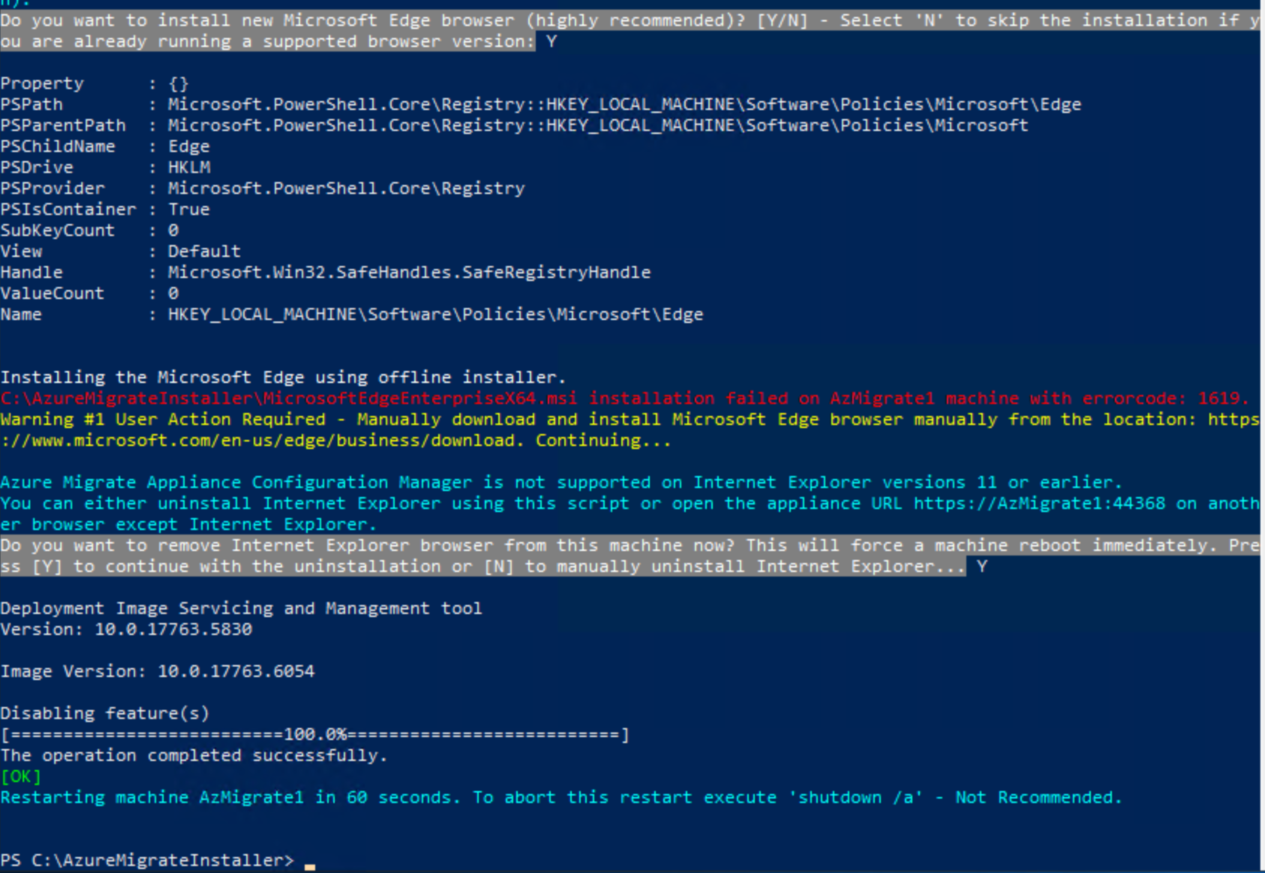
A computer screen shot of a blue screen description automatically generated

After the server reboots, log back in and install Microsoft Edge if it wasn’t automatically installed.

4) Configure the Azure Migrate Appliance

Launch Azure Migrate Appliance Configuration Manager on the desktop of AzMigrate1.
A blue and white sign with text description automatically generated

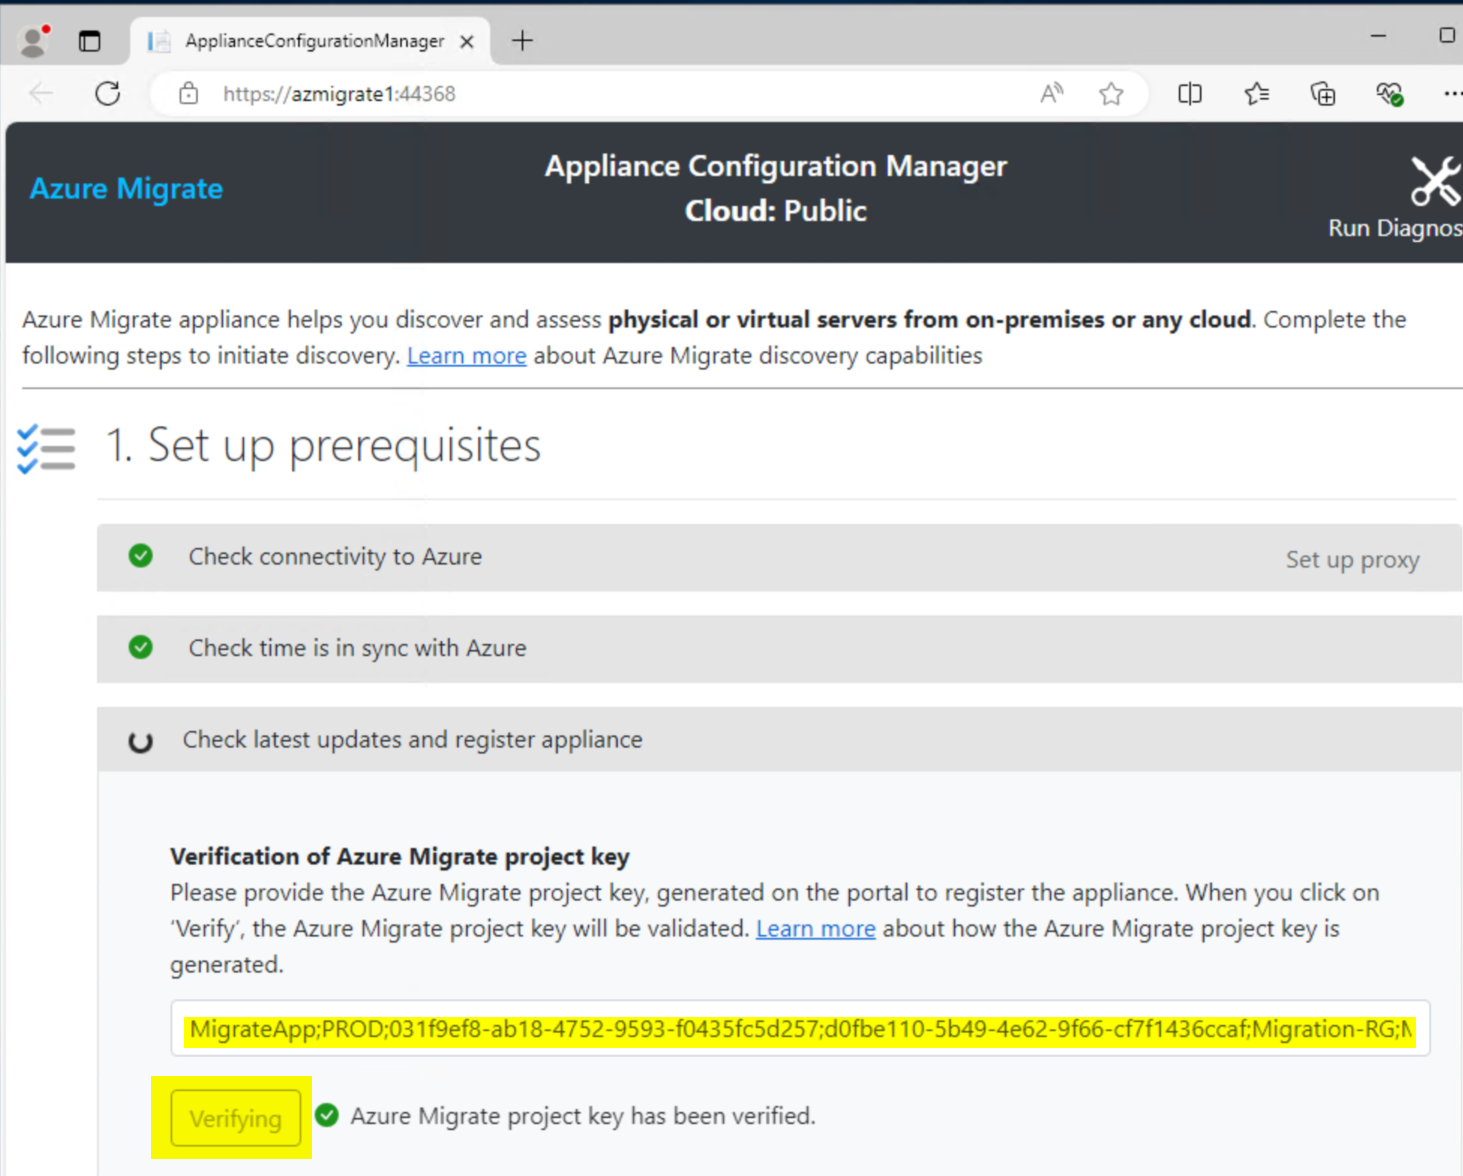
Use the project key you saved earlier. If lost, go back to the Azure Migrate project, click Overview, then Manage Appliances, and find the Unregistered appliance to get the key again.

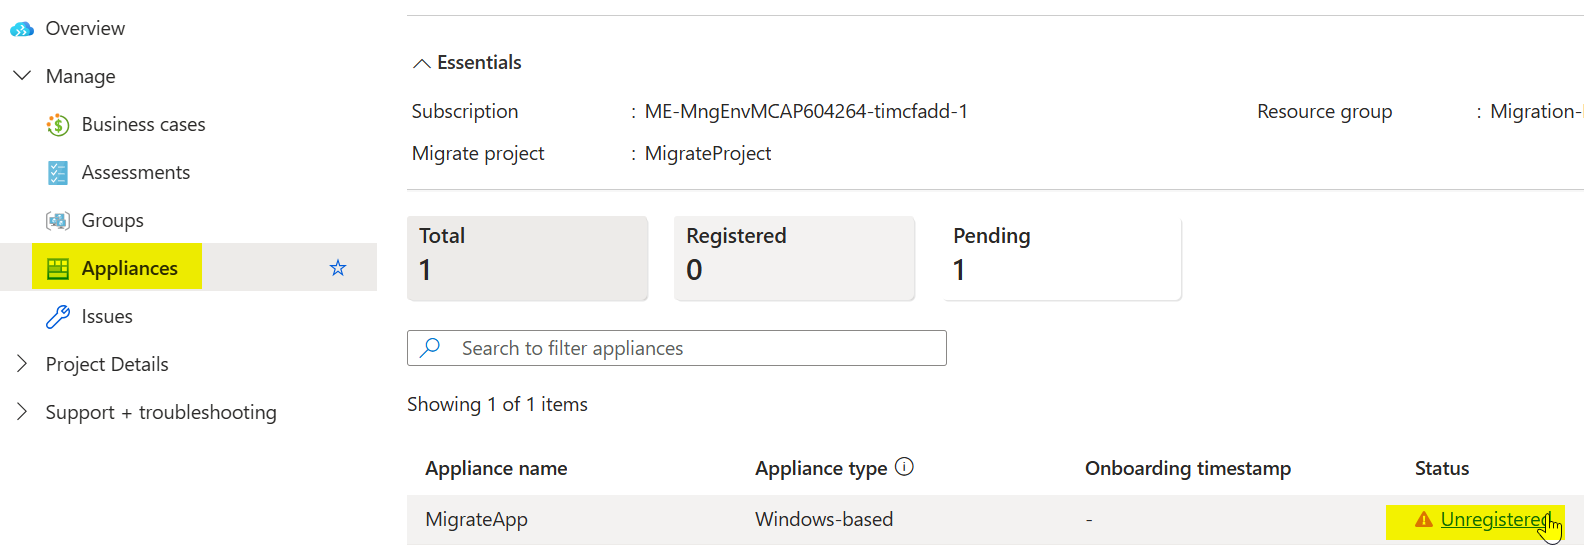
A screenshot of a computer description automatically generated

Paste the key and click Verify. After verification, click Login. Click Copy code & Login, then sign in with an account that has rights to access the Migrate project and resources. You should see a success message stating the appliance is registered.
A screenshot of a computer description automatically generated

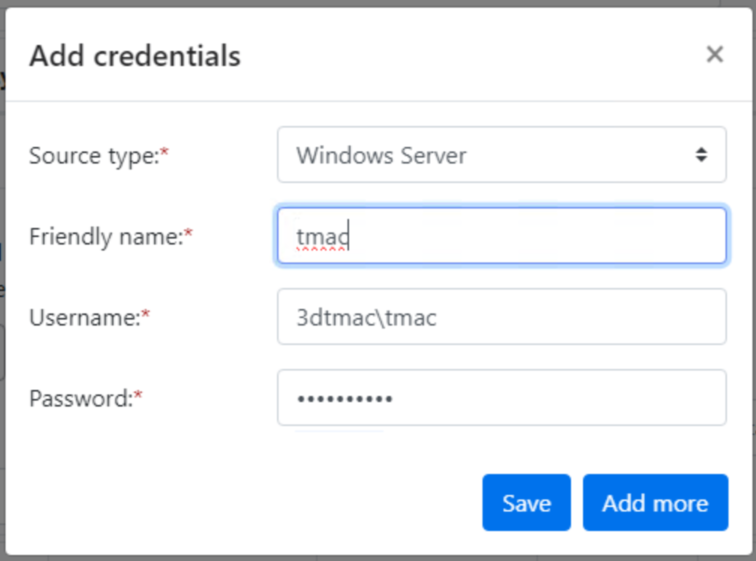
Add credentials for an admin user that can run discovery (use domain\username format).
A screenshot of a computer login description automatically generated

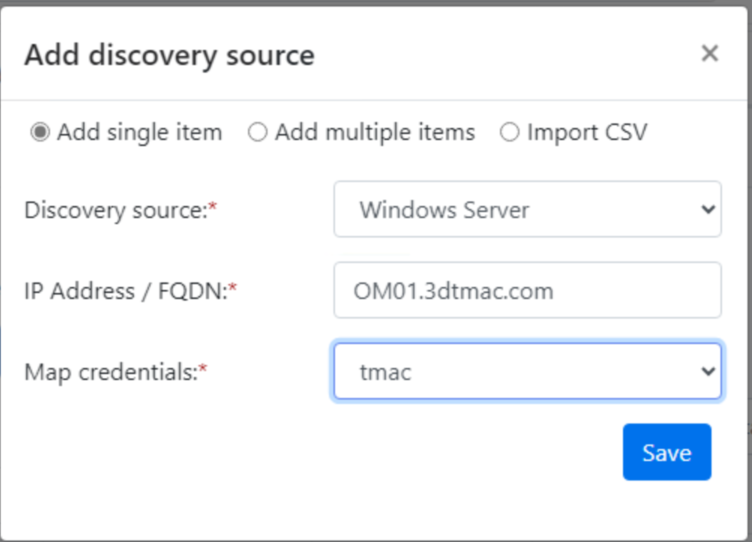
Click Add Discovery Source. Enter the FQDN of the server(s) you want to migrate. You can list multiple servers.
A screenshot of a computer description automatically generated

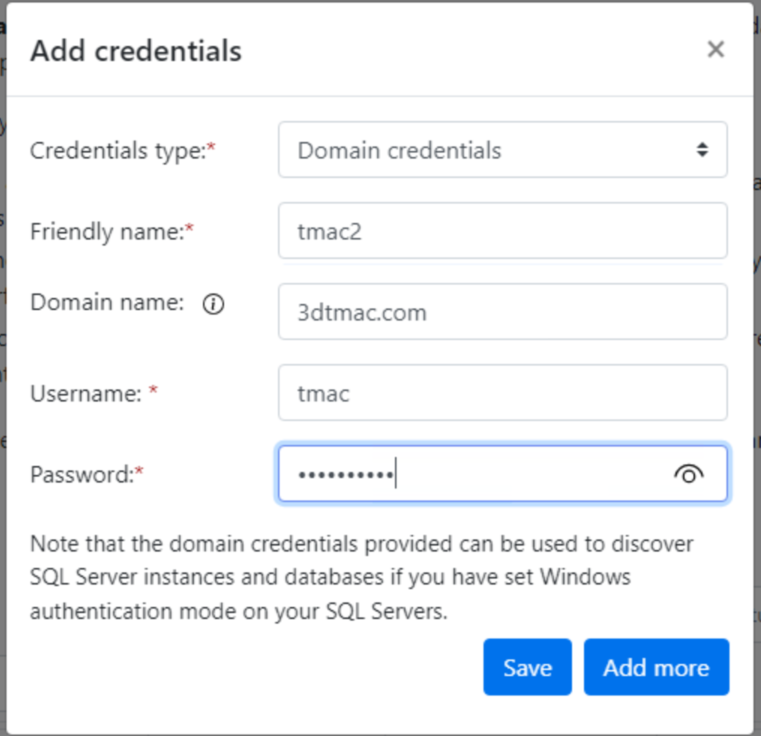
For software inventory and dependency analysis: It’s recommended to add credentials here as well. Even though you added them before, this step ensures inventory runs properly. You can specify application-specific credentials if needed.
A screenshot of a computer description automatically generated

Click Start Discovery. After discovery completes, go back to the Azure portal and refresh the Azure Migrate project page.
A blue rectangle with white text description automatically generated

Click Discovered Servers to see the discovered servers. You can run an assessment if desired for VM size recommendations, though it’s not required for migration.

5) Set Up the Replication Server

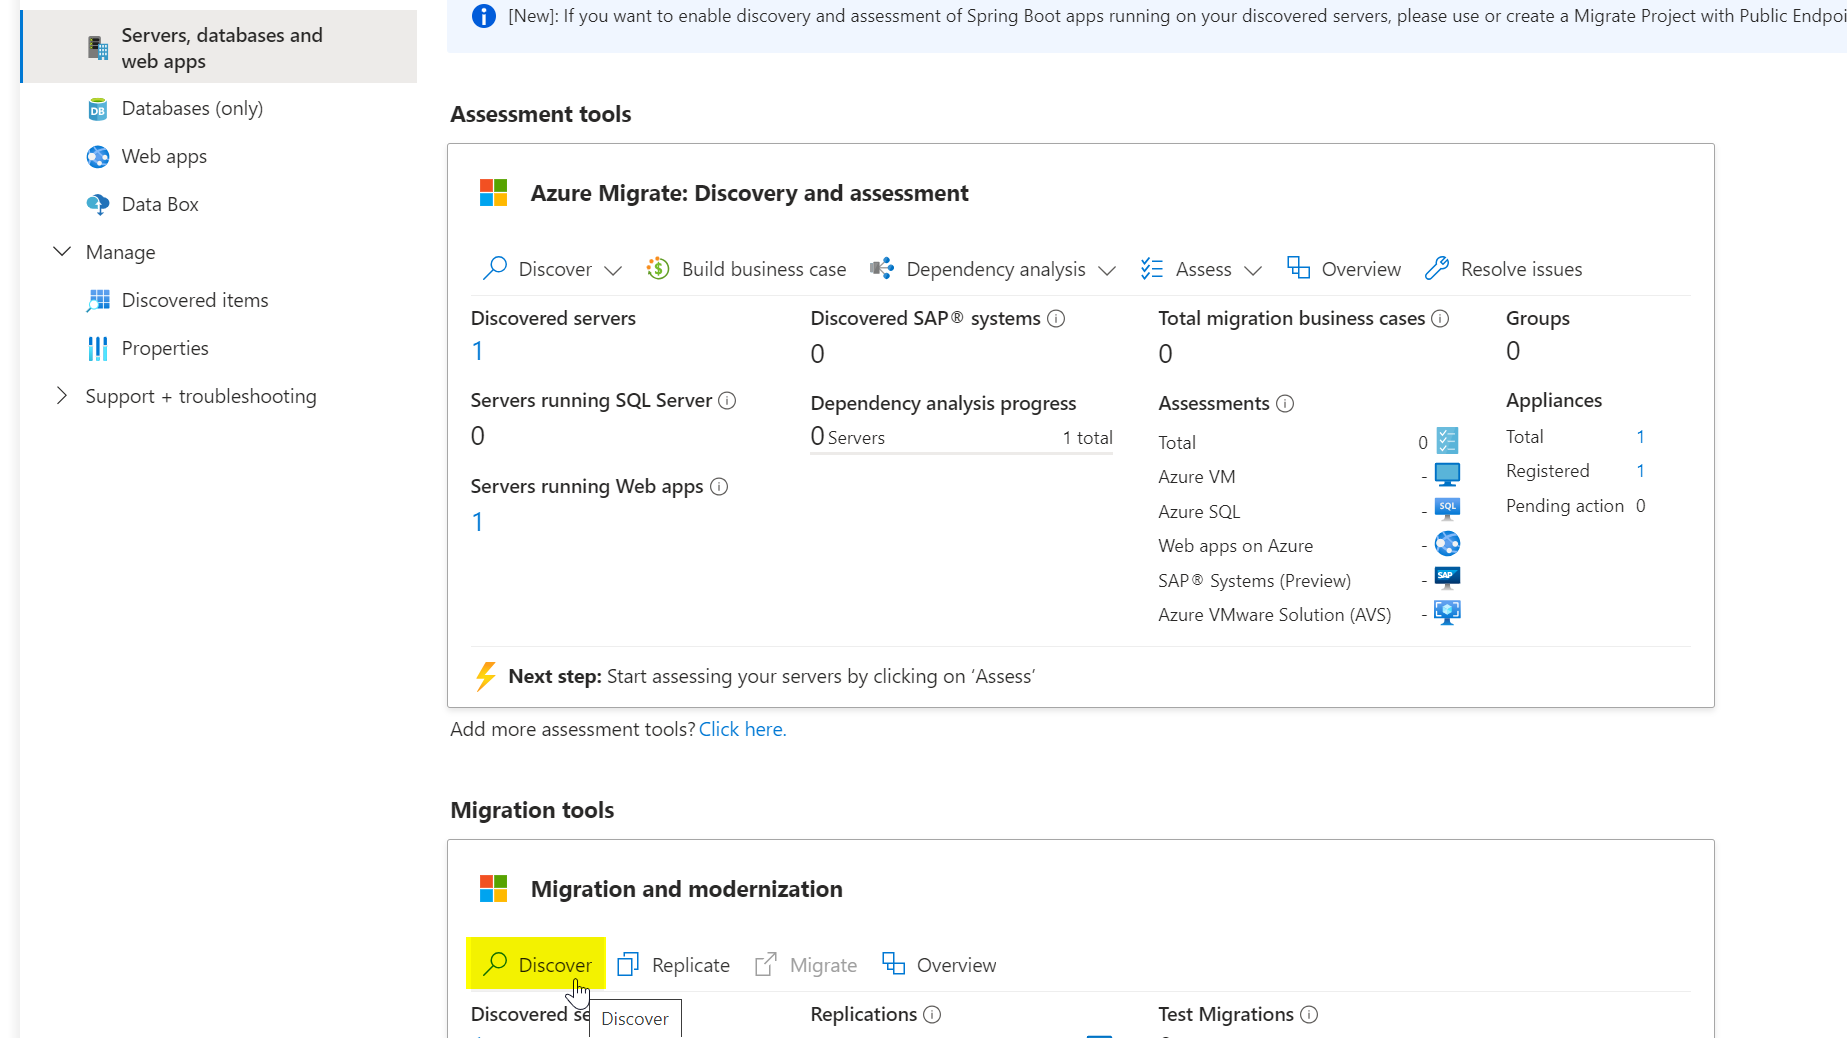
Under Migration and Modernization, click Discover.
A screenshot of a computer description automatically generated

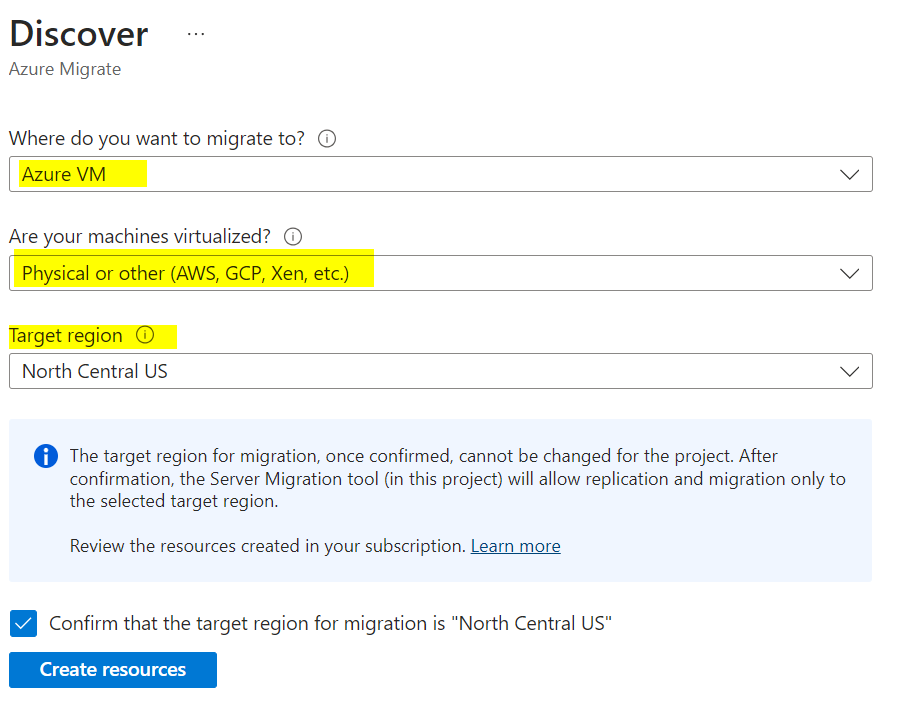
Choose Azure VM as the target.

For virtualization, select Physical or other.

Select the target region where you plan to migrate the VMs. Be sure to pick the correct region, as you can’t change it later for this migrate project.
A screenshot of a computer description automatically generated

Choose Install a replication appliance. Download both the replication appliance and the registration key file.

A screenshot of a computer program description automatically generated

Copy them to AzReplicate1.

Launch MicrosoftAzureSiteRecoveryUnifiedSetup on AzReplicate1.

Leave the default option: Install the configuration server and process server.

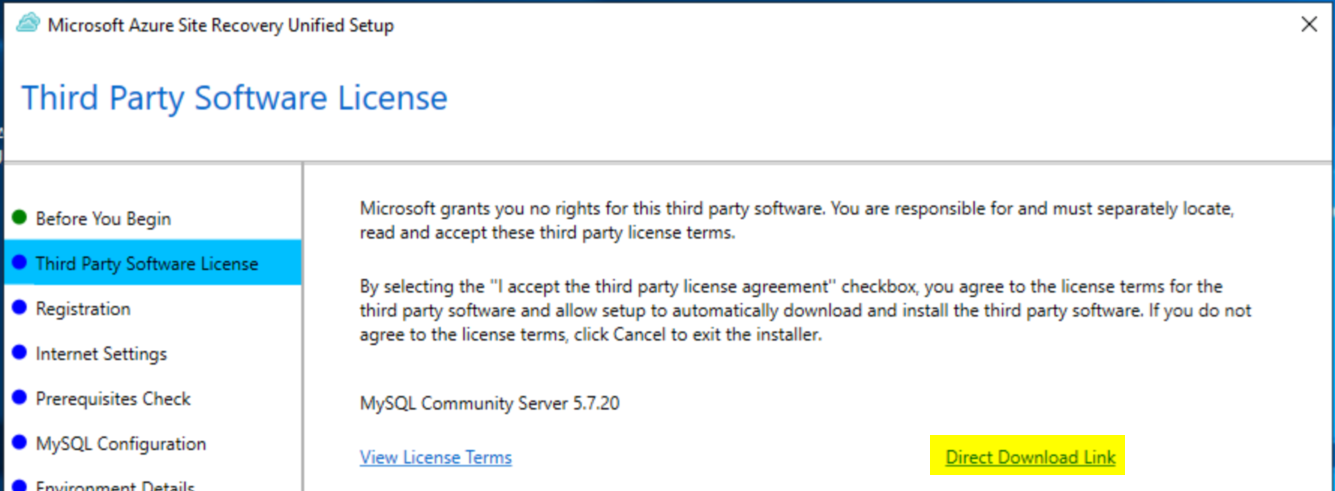
You’ll need MySQL Community Server. Download it beforehand because the installer may fail to install MySQL when using private endpoints.
A screenshot of a computer description automatically generated

Download MySQL from: MySQL Installer

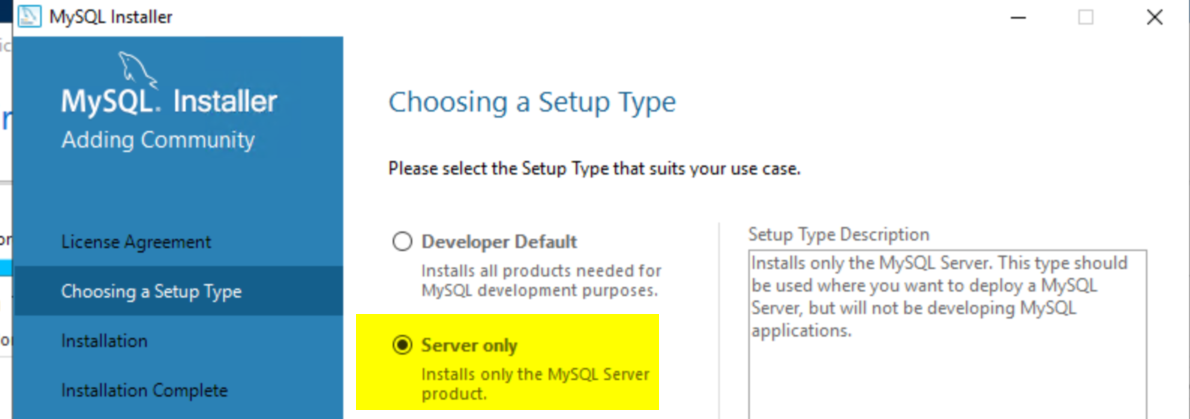
Install MySQL (Server Only). You may need Microsoft Visual C++ 2013 Redistributable (both 32-bit and 64-bit) due to a MySQL bug. Install both, then proceed with MySQL installation.
A screenshot of a computer description automatically generated

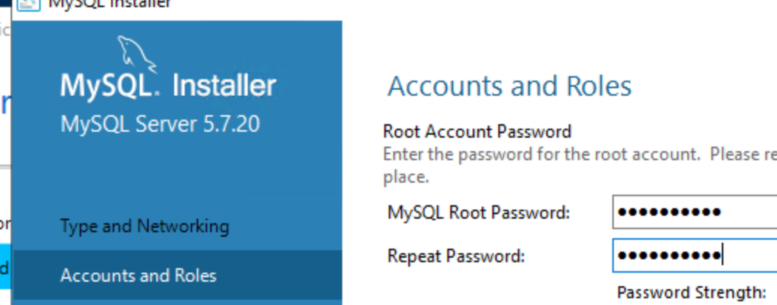
Use a password for MySQL—this will be needed by the Azure Replication Server installer.
A blue square with white text description automatically generated

Finish the MySQL configuration and return to the Azure Site Recovery Unified Setup wizard. Provide the key file (.VaultCredentials) you downloaded earlier and proceed with the setup.

A screenshot of a computer description automatically generated

Run prerequisite checks, enter the MySQL password, and when prompted, select No for environment details.

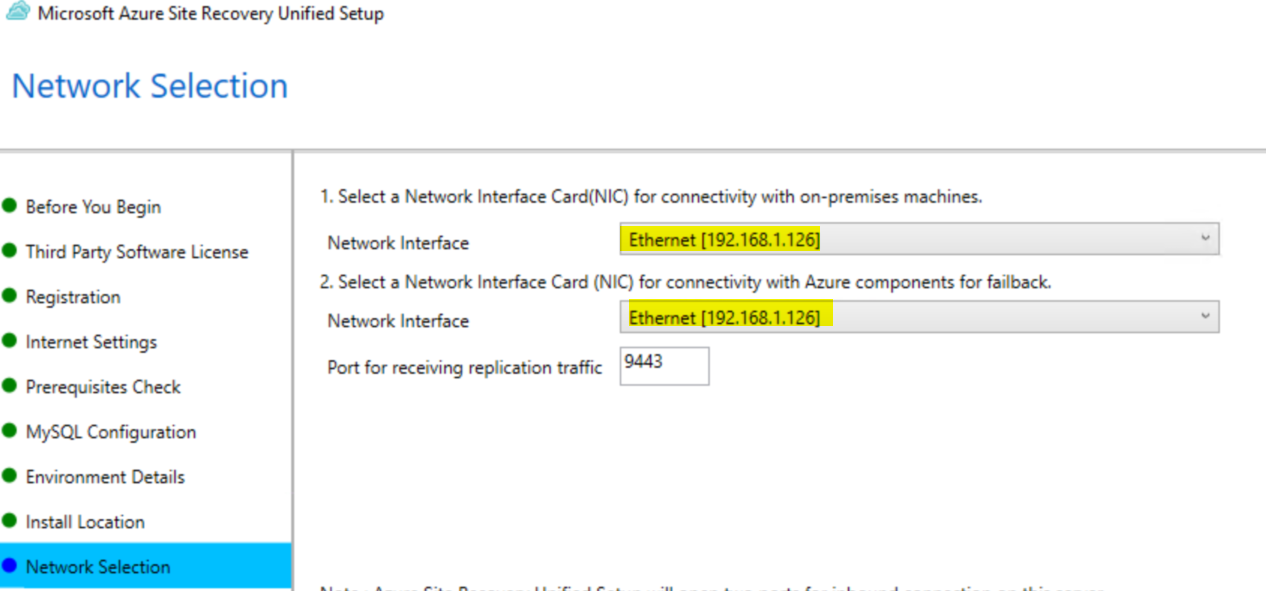
Select network interfaces as needed and click Next.
A screenshot of a computer description automatically generated

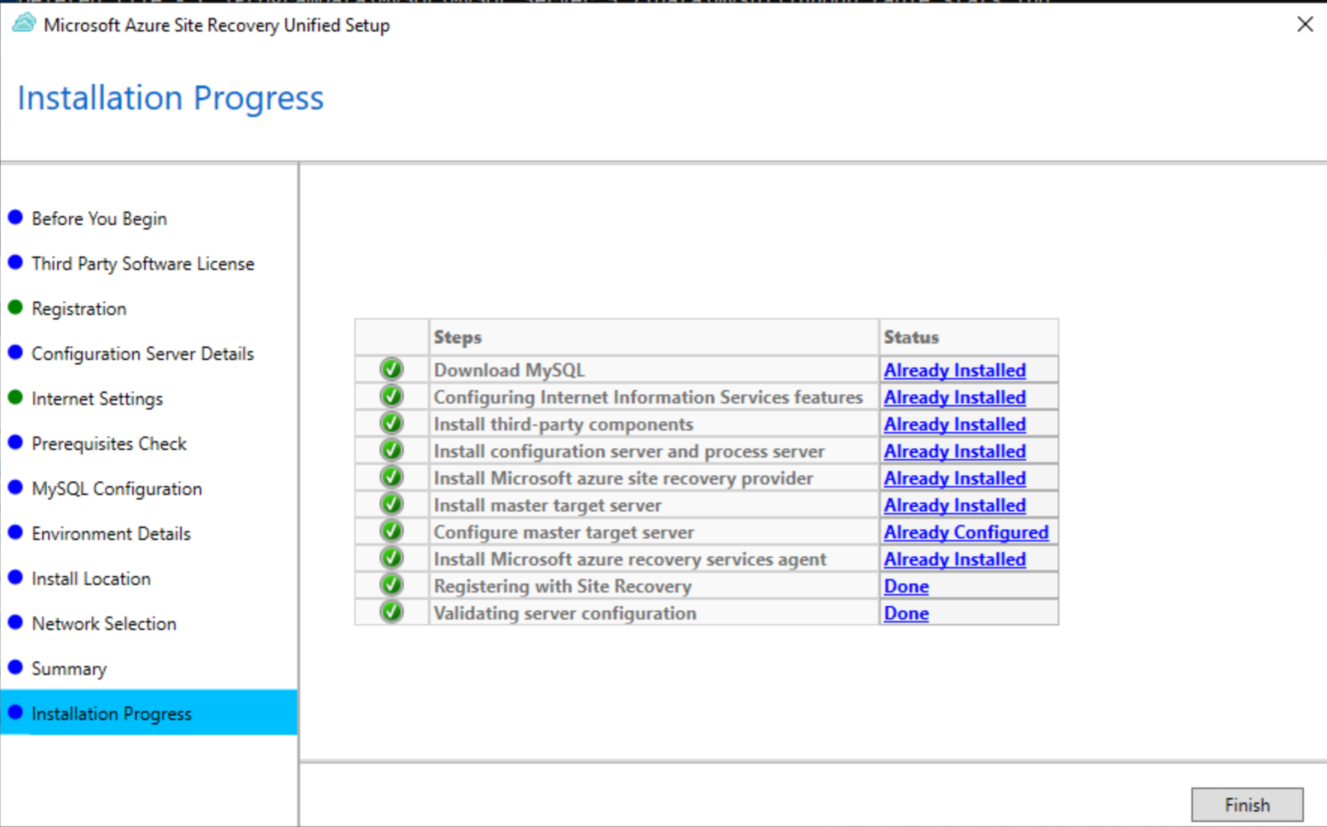
Before installation, you may need to run some commands to fix MySQL permissions or remove leftover data if the setup fails. Stop MySQL, delete the data directory, and ensure no mysqld.exe processes are running. Reset permissions and clear temp files if necessary.
A screenshot of a computer program description automatically generated

Save the configuration server passphrase to a file named passphrase.txt. You will need this later.
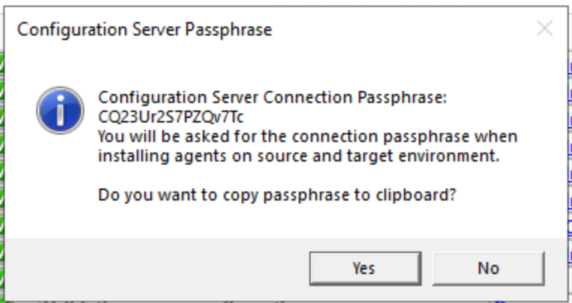
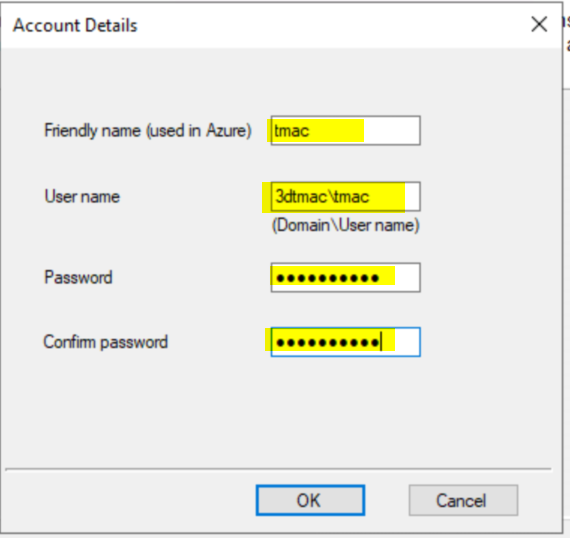
On the Microsoft Azure Site Recovery Configuration Server page, click Add Account to add the account and credentials used previously.
A screenshot of a computer description automatically generated

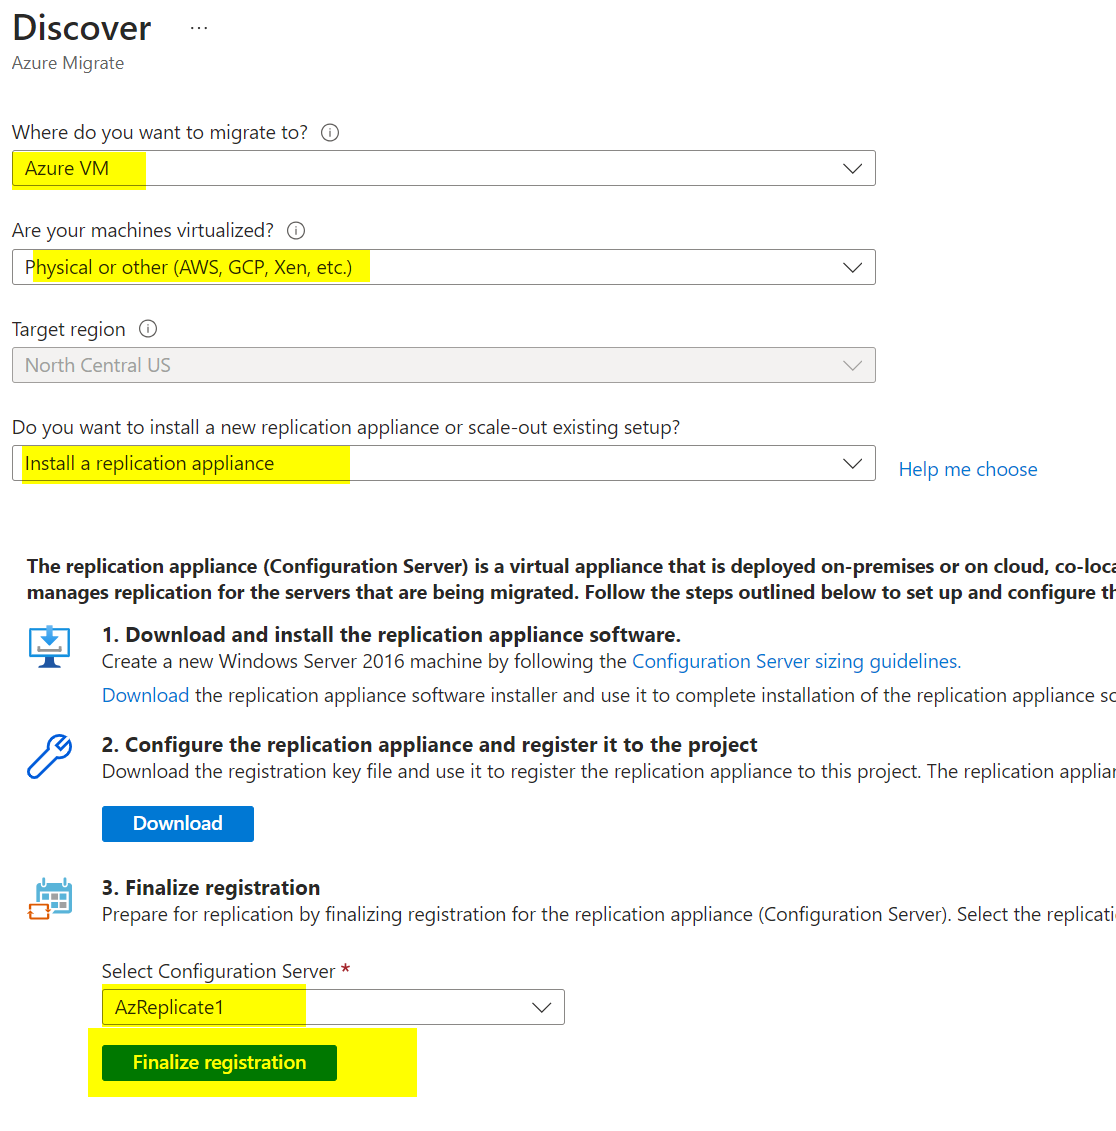
Go back to Azure Migrate, under Migration tools click Discover again. Make the same selections, but now select your configuration server and click Finalize registration.
A screenshot of a computer description automatically generated

You should see a success message. Click Close.

6) Install and Configure the Mobility Agent on the Source Server

On AzReplicate1, browse to C:\Program Files (x86)\Microsoft Azure Site Recovery\home\svsystems\pushinstallsvc\repository and find the Microsoft-ASR_UA_9.61.0.0_Windows_GA_18Mar2024_Release.exe file. Copy this to the server you want to replicate.

Follow the official instructions for installing the Mobility Service via command prompt: Microsoft Docs

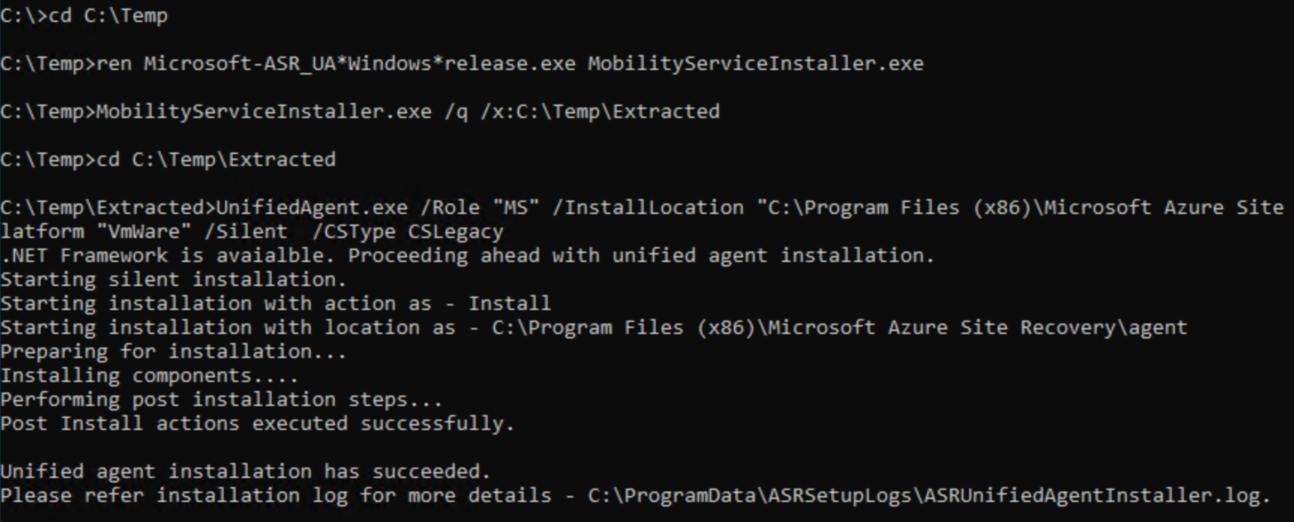
Copy the installer to C:\Temp on the source server. Run:

cd C:\Temp
ren Microsoft-ASR_UA*Windows*release.exe MobilityServiceInstaller.exe
MobilityServiceInstaller.exe /q /x:C:\Temp\Extracted
cd C:\Temp\Extracted
UnifiedAgent.exe /Role "MS" /InstallLocation "C:\Program Files (x86)\Microsoft Azure Site Recovery" /Platform "VmWare" /Silent /CSType CSLegacy
A computer screen with white text description automatically generated

Use the passphrase you saved earlier. If you forgot it, run the following on AzReplicate1:

C:\ProgramData\ASR\home\svsystems\bin\genpassphrase.exe -v

A blue background with white text description automatically generated

Create passphrase.txt on the source server in C:\Temp\Extracted and paste the passphrase there.

Get the IP of AzReplicate1 and run:

cd "C:\Program Files (x86)\Microsoft Azure Site Recovery\agent"
UnifiedAgentConfigurator.exe /CSEndPoint /PassphraseFilePath C:\Temp\Extracted\passphrase.txt

A computer screen with text on it description automatically generated

Wait 15-30 minutes for the registration to complete.

7) Create an Azure Storage Account for Replication

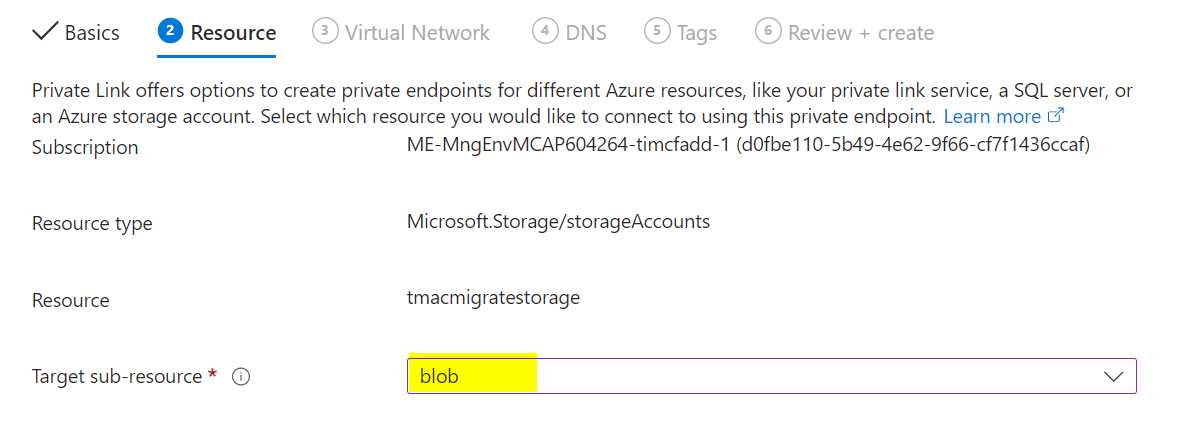
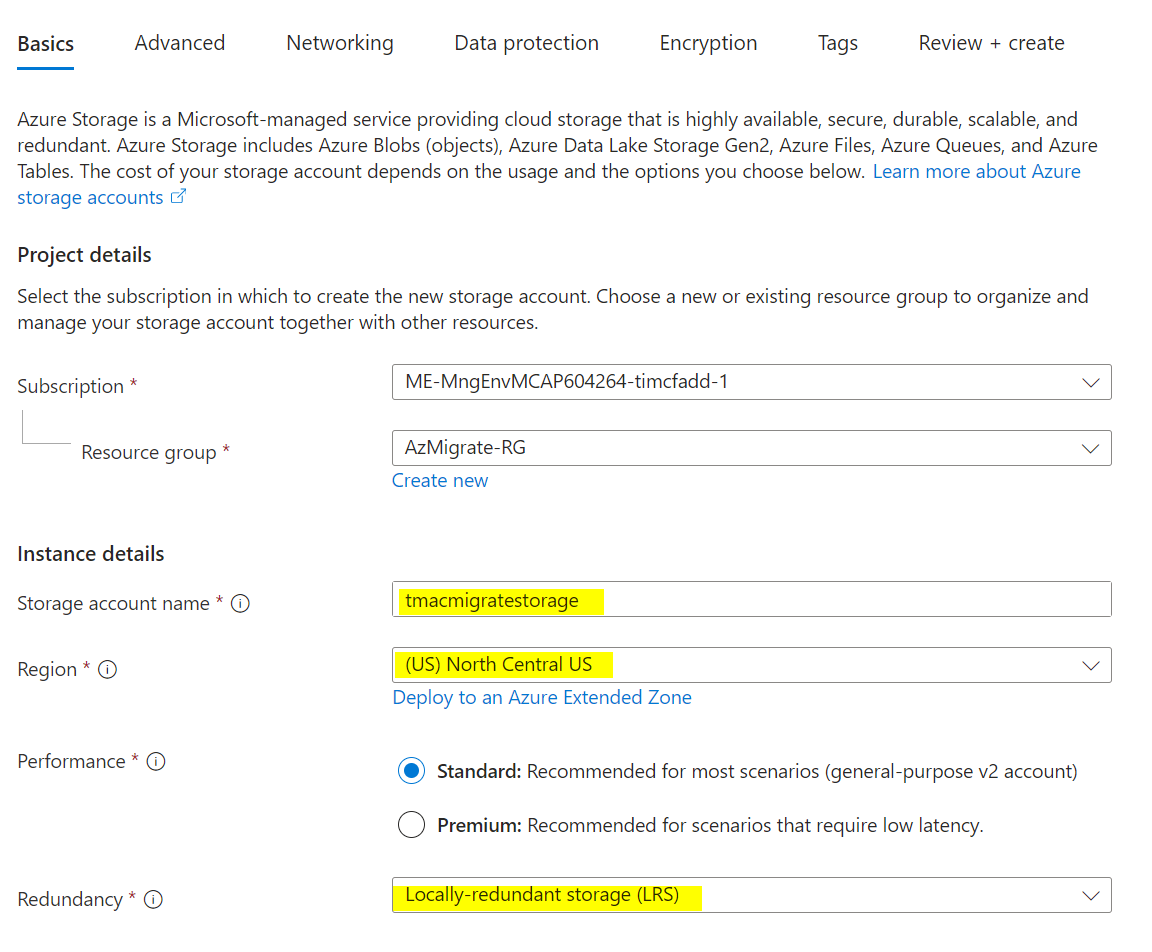
Create an Azure Storage account in the same region you selected for replication.
A screenshot of a computer description automatically generated

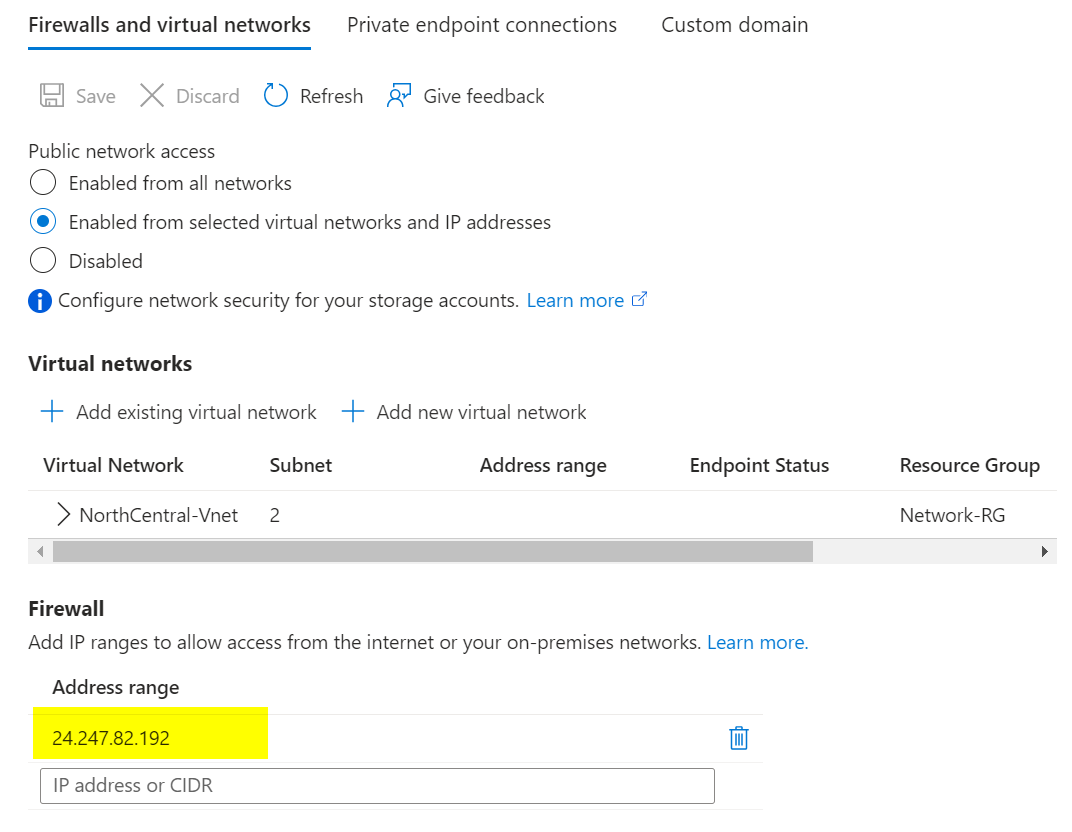
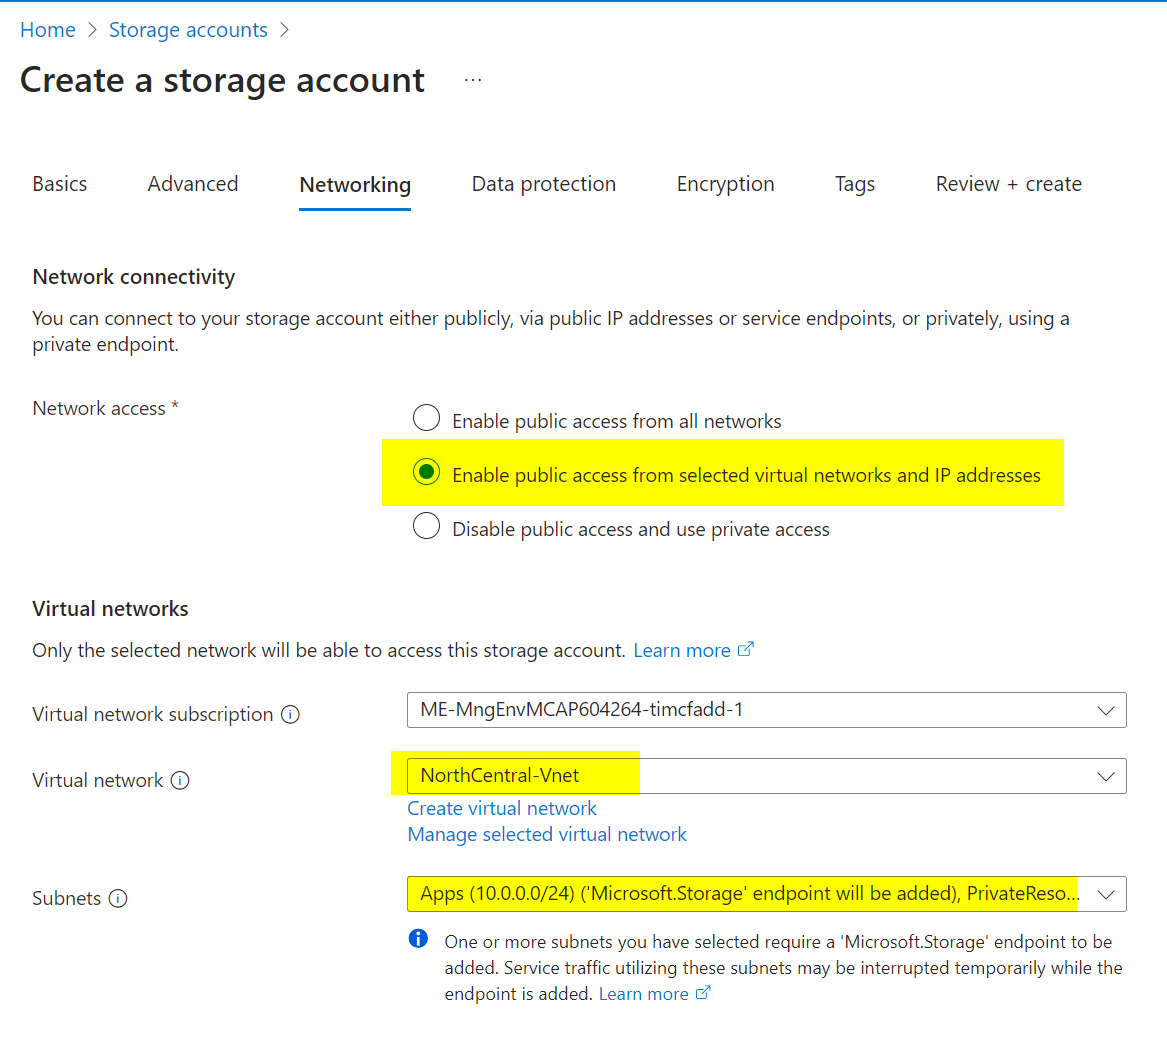
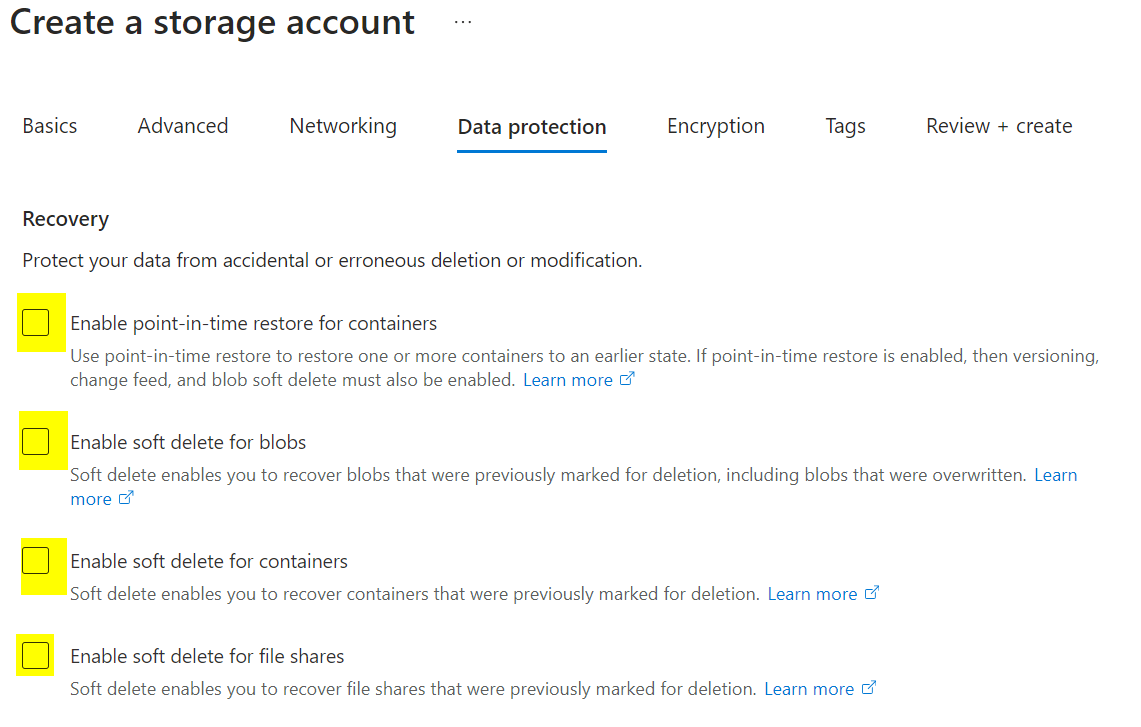
Under Networking, enable public access from selected virtual networks and IP addresses as needed. Under Data Protection, uncheck all backup and replication options. Leave other defaults and create the storage account.
A screenshot of a computer description automatically generated
A screenshot of a computer error description automatically generated

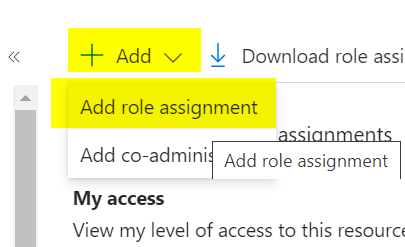
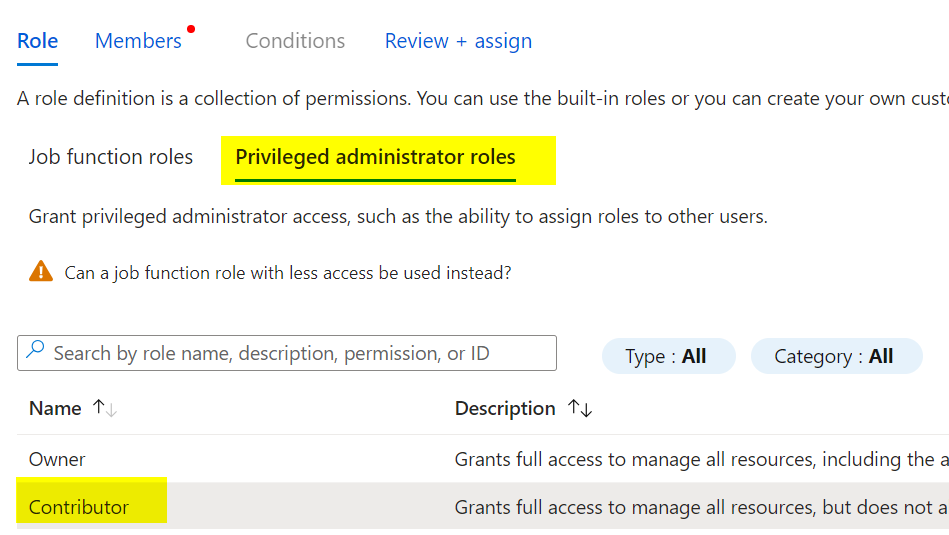
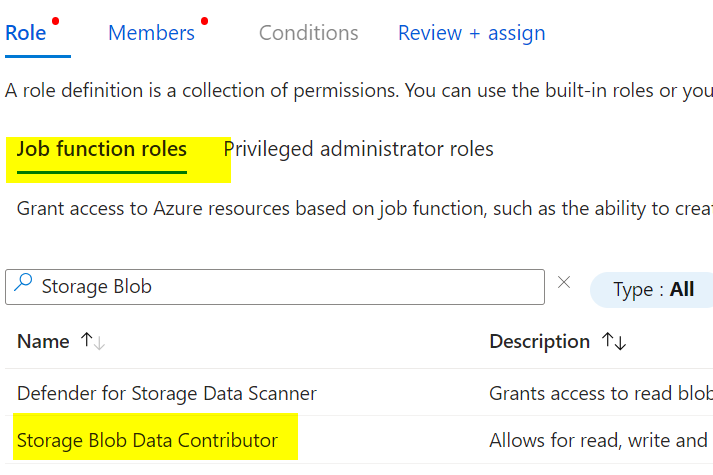
Follow the Microsoft documentation for required permissions. Assign Contributor and Storage Blob Data Contributor roles to the Managed Identity for the vault and migrate project at the storage account level.

A screenshot of a computer description automatically generated

8) Start Replication

Return to the Migrate project and select Replicate. Choose Physical or other as the source, and select the region, storage account, and network you configured.
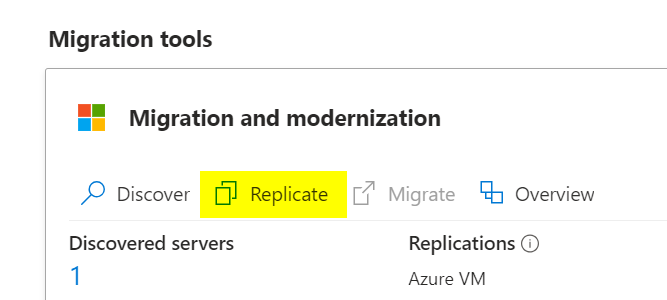
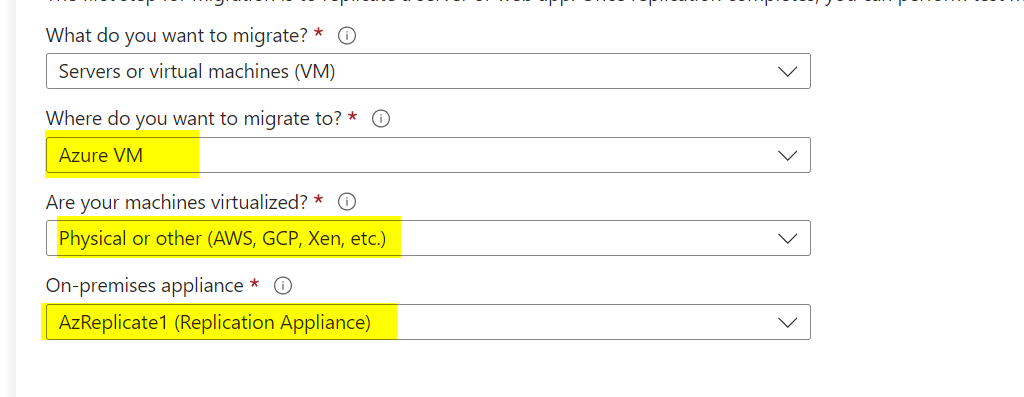
A screenshot of a computer description automatically generated

Under “Virtual Machines,” select “No, I’ll specify” and choose the servers you discovered earlier. Set the VM size, disk type, and other settings as needed.
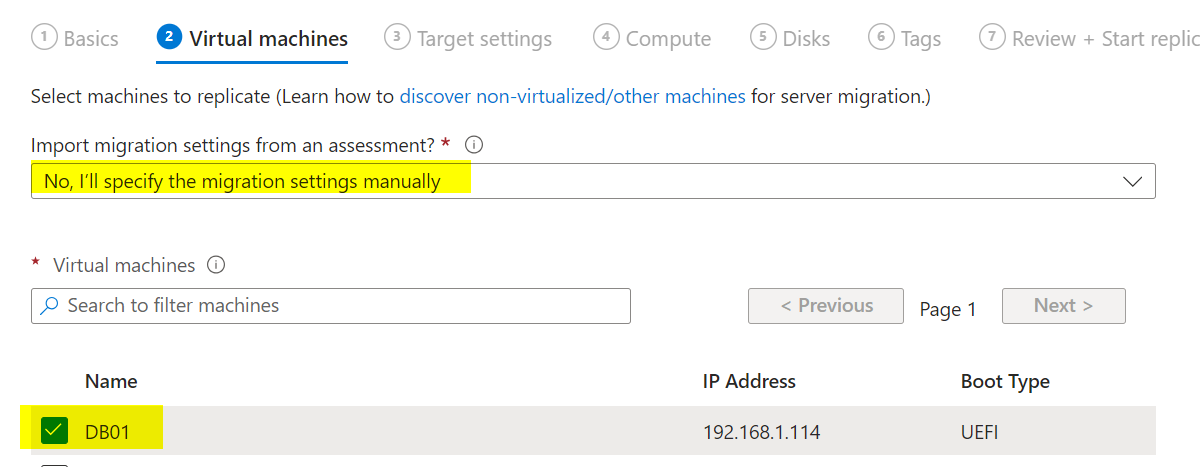
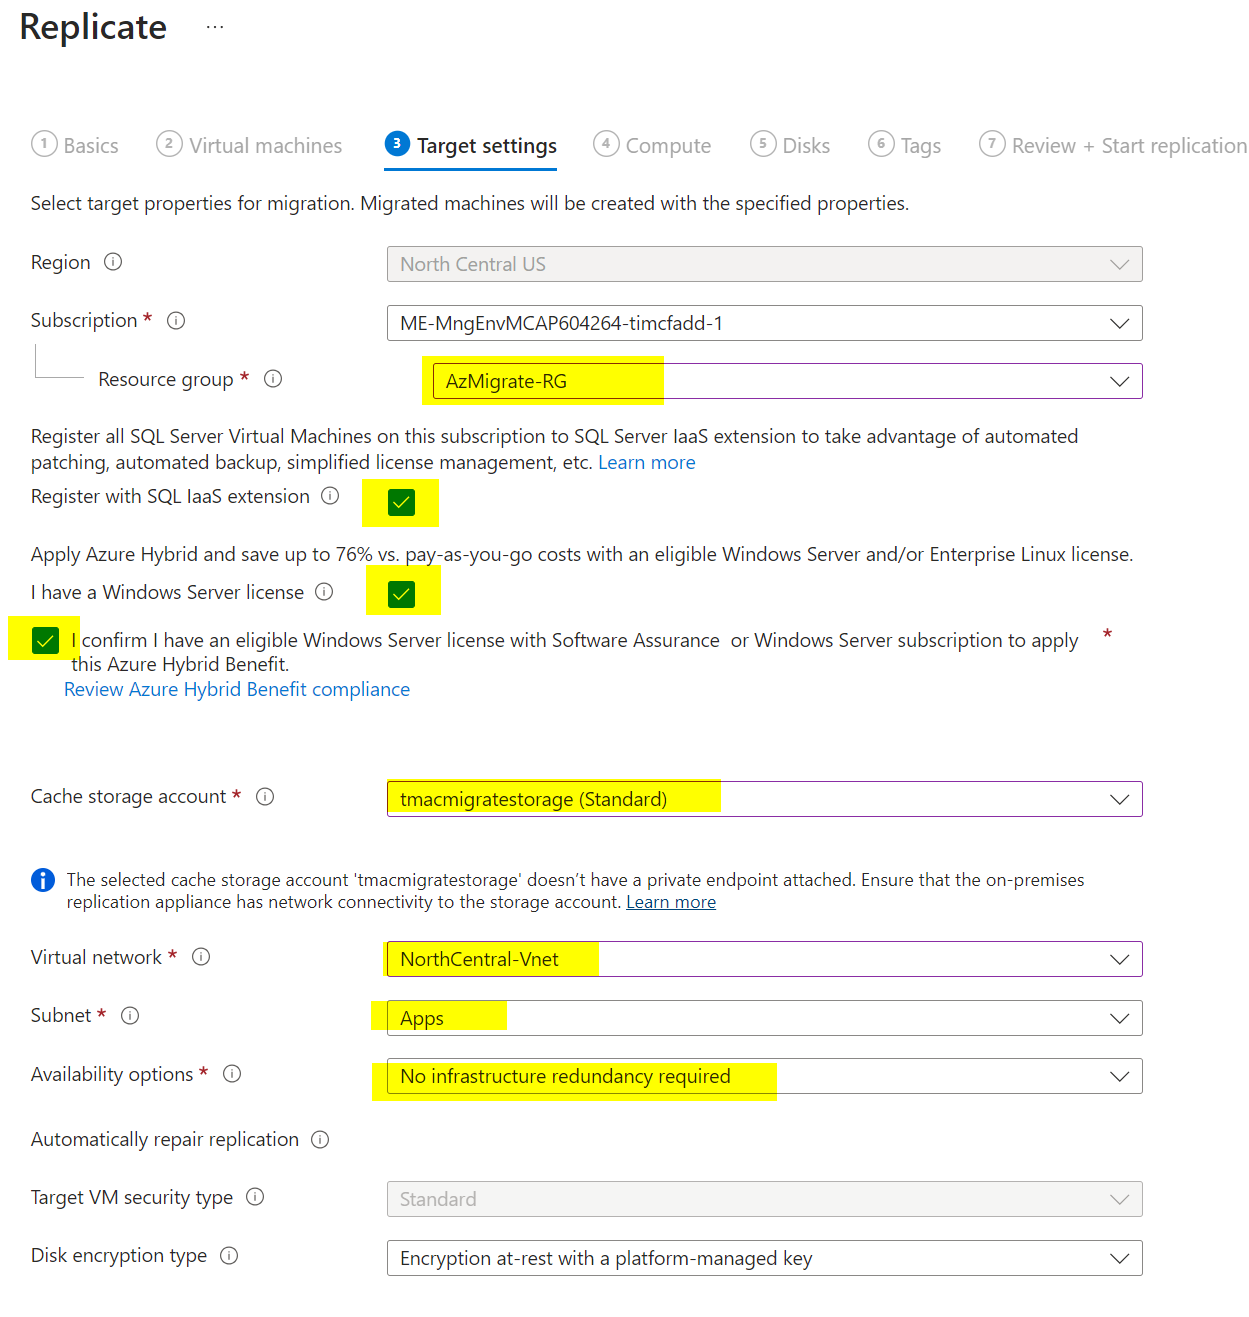
A screenshot of a computer description automatically generated

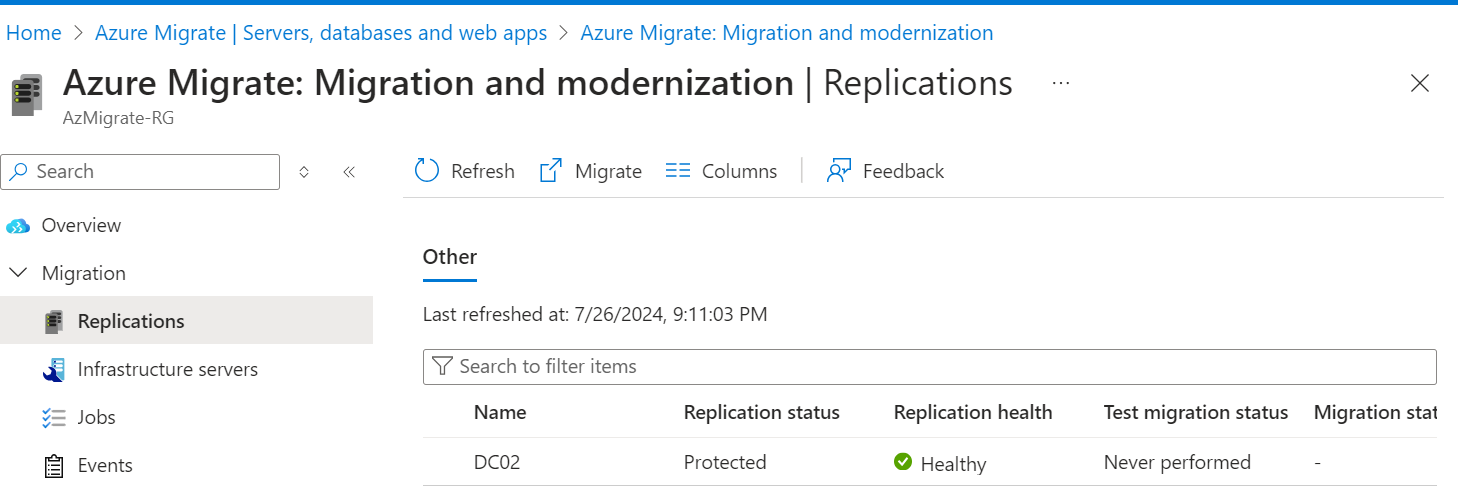
Click Start Replication. Once replication starts, you can monitor its status in the portal. It may take several hours to complete.

A screenshot of a computer description automatically generated

Once replication is complete, you can perform a test migration. Be careful, as this will bring the server online in Azure. Consider turning off the on-premises server before the test to avoid conflicts.

A screenshot of a computer description automatically generated

After testing, clean up the test migration to remove the test VMs.

A screenshot of a computer description automatically generated

After verification, you can finalize the migration.

This concludes the detailed process of migrating physical VMs using Azure Migrate with private endpoints.
Continue Reading

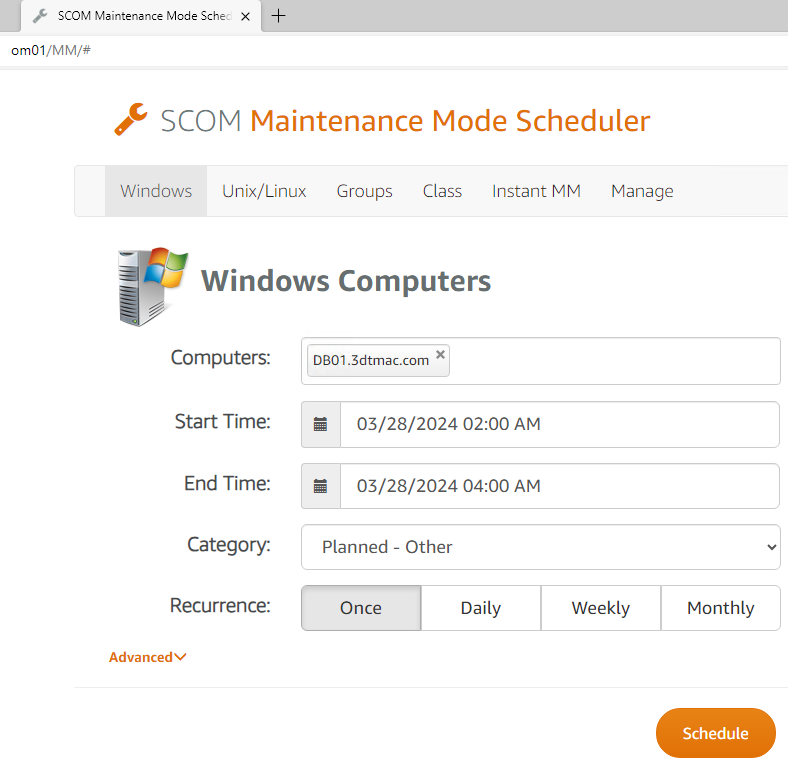
Introducing SCOM Maintenance Mode Scheduler 2.1 : Faster, More Flexible, Azure-Ready!

We’re excited to announce the release of SCOM Maintenance Mode Scheduler version 2.1, a significant update bringing powerful features and improvements to our users. This release includes enhanced support for Azure SCOM Managed Instances, performance optimizations, CSV import enhancements, and bug fixes, ensuring a smoother and more efficient maintenance scheduling experience.

Download

What’s New in 2.1?

  1. Azure SCOM Managed Instances Support – Expanding our horizon, version 2.1 introduces full support for Azure SCOM Managed Instances. This feature allows users to seamlessly integrate their Azure-managed environments with the SCOM Maintenance Mode Scheduler, providing a unified maintenance management solution across cloud and on-premises infrastructures. Now, managing maintenance windows for Azure SCOM Managed Instances is as effortless as for your on-premises servers.


  2. Speed Enhancements – We understand that time is of the essence. That’s why we’ve optimized our website to load faster, providing you with a swift and responsive experience. Whether you’re scheduling maintenance, viewing upcoming windows, or accessing reports, you’ll notice a significant improvement in performance.

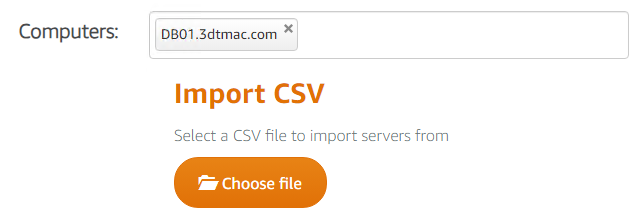
  3. CSV Import Improvements – Importing your server list has never been easier. With version 2.1, the CSV import functionality has been enhanced for greater flexibility. You no longer need to format your list strictly as a true CSV file. Now, you can import a straightforward list of computers, similar to the functionality available in the SCOM 2012 Maintenance Mode Scheduler. This improvement streamlines the process, saving you time and effort when managing large numbers of servers.

  4. Bug Fixes – We’re committed to providing a reliable and bug-free experience. In version 2.1, we’ve addressed several minor bugs, further stabilizing the application and enhancing its overall performance. These fixes are part of our ongoing effort to ensure the SCOM Maintenance Mode Scheduler meets your needs and exceeds your expectations.

Getting Started with 2.1

Upgrading to version 2.1 is straightforward and we strongly encourage all our users to update to take advantage of these new features and improvements. Visit our website for more details on the upgrade process and to download the latest version.

We’re excited to see how these new features will empower your maintenance management processes. As always, we value your feedback and are here to support you. Should you have any questions or need assistance, please don’t hesitate to reach out.

Thank you for choosing SCOM Maintenance Mode Scheduler. Here’s to making maintenance management smoother and more efficient than ever!

Continue Reading

Azure Maintenance Mode Scheduler

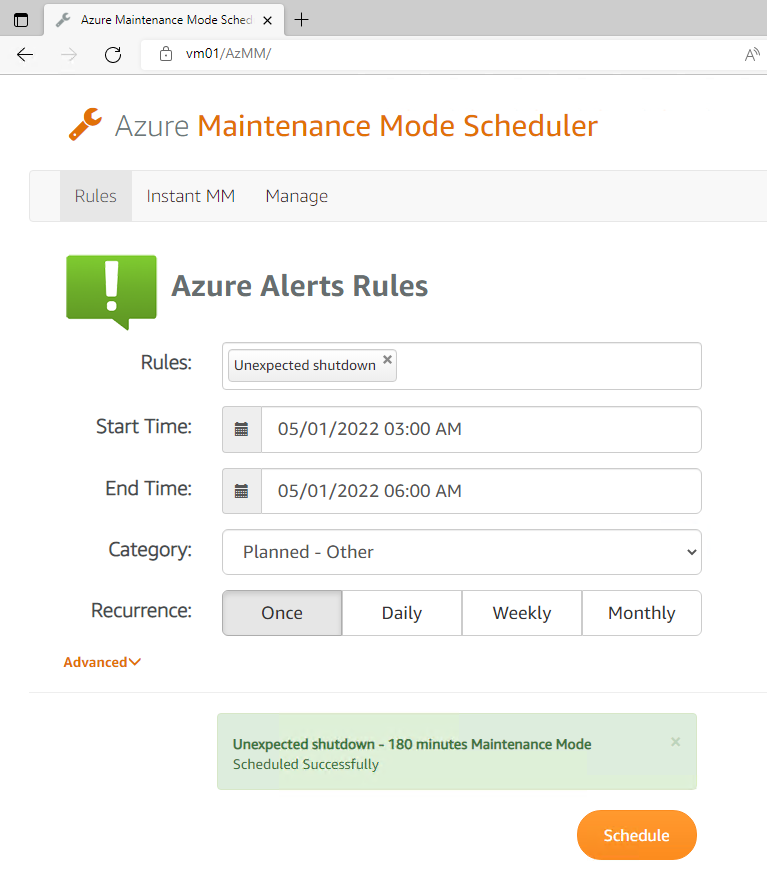
Azure Maintenance Mode Scheduler enables you to schedule maintenance windows for any Azure Alert. It also gives you the ability to immediately put an Alert into maintenance mode for an hour or a few days while you are working on an issue. Without the Azure Maintenance Mode Scheduler, often times engineers manually disable alerts and then forget to re-enable them or even worse they don’t disable them at all and the alerts become noise that gets ignored.

Features:

  • Easily access web based maintenance mode scheduler from any browser (Chrome, Edge, Safari and IE)
  • Schedule Azure Alerts for maintenance in a few seconds.
  • Import a CSV or text list of Alerts for scheduled maintenance.
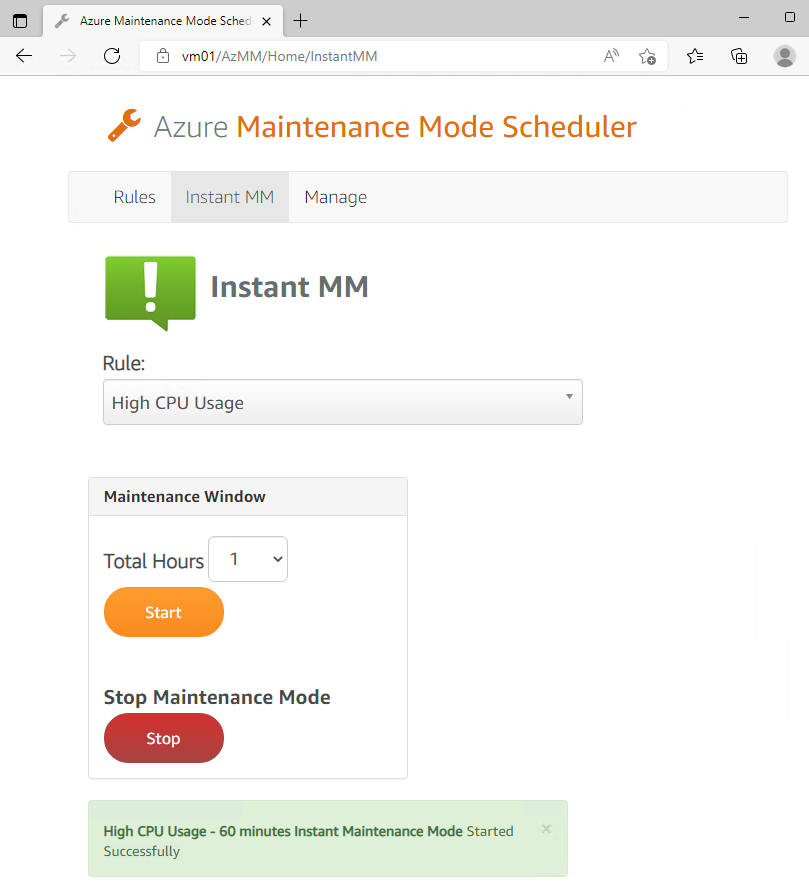
  • Instant MM: Server and application admins can instantly place Azure Alerts into maintenance before reboots and maintenance.
  • Instant MM can be called by a PowerShell or Unix Shell script from anywhere. This can be used to start and stop maintenance on any server for a specified amount of time. This makes it easy to integrate into your current change or software management process.
Download

Instant Maintenance Mode

This solution makes it easy for IT staff to put a server into maintenance mode without having to go to the Azure console. Anywhere on your network, the administrator can visit the Azure Maintenance Mode Scheduler Instant MM website at http://yourMMserver/Home/MM/InstantMM

Create a shortcut on the desktop of the servers to make it even easier.

Instant MM can be called by a PowerShell or Unix Shell script

Using URL Parameters, you can put Azure Alert rules into Maintenance Mode from any computer using a script. Typical use case would be using SCCM when updates or software is installed. SCCM would execute the PowerShell script before the install process to start maintenance mode. After the updates or software is installed SCCM would call the script to stop maintenance mode.

PowerShell Example Download: https://www.scom2k7.com/downloads/AzureMM.ps1.txt

param (
    [Parameter(Mandatory=$true)][string]$mmServer,
    [Parameter(Mandatory=$true)][string]$ruleName,
    [Parameter(Mandatory=$true)][string]$min,
    [Parameter(Mandatory=$true)][string]$action
 )

 $FullURL = "http://" + $mmServer + "/AzMM/Home/InstantMM?RuleName=" + $ruleName + "&Min=" + $min + "&MMAction=" + $action
 $FullURL

Invoke-RestMethod $FullURL -Method 'POST'

Unix/Linux Example Download: https://www.scom2k7.com/downloads/AzMM.sh

RuleName=$2
RuleName=$( printf "%s\n" "$RuleName" | sed 's/ /%20/g' )

url="http://$1/AzMM/Home/InstantMM?RuleName=$RuleName&Min=$3&MMAction=$4"

echo $url

wget $url --method POST 
Continue Reading

Monitoring a Hot Tub or Pool with Azure Monitor and Azure Log Analytics Part 5 – Tip and Tricks

Part 1 – Hardware and Software Setup || Part 2 – Azure Setup || Part 3 – Dashboarding and Workbooks || Part 4 – Alerting || Part 5 – Tips and Tricks

In Part 5, I have a couple tips and tricks.

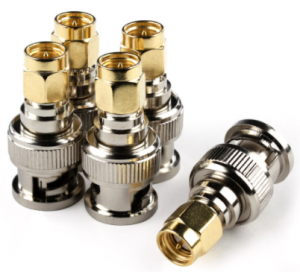
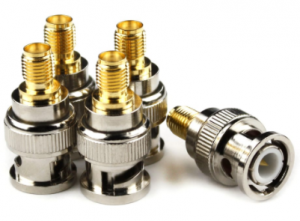
I don’t like the idea of having a plug near my Hot Tub so I purchased some of these connectors to go from SMC to BNC.

Link

Link

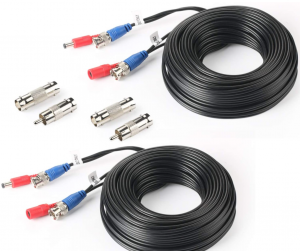
Then I ran 3 33ft standard BNC cables from my basement to my raspberry PI to the sensors in my hot tub.

After a while my ORP and PH sensors wore out after being submerged in water for over a year.

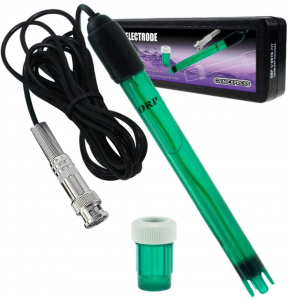
I purchased this cheaper ORP sensor that works better and last longer. Link

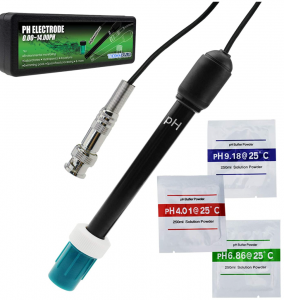
I also switch to this PH Sensor. Link

How to import the workbook into Azure.

Download the workbook from https://github.com/timmcfadden/HotTubMonitoring

Open up the HotTub.workbook in Notepad++ or VSCode

Copy out the JSON.

Create a new workbook in Azure Workbooks.

Click Advanced Editor

Leave it on Gallery Template and Paste in the JSON code and click Apply.

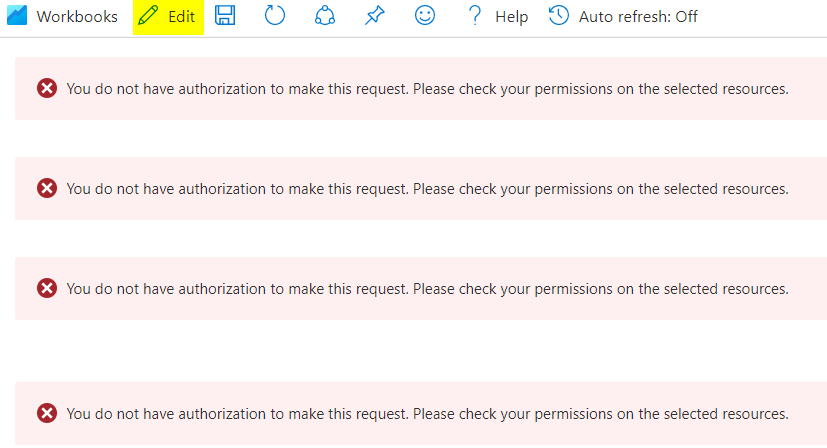
You will see a bunch of red X’s. We need to change to your Log Analytics workspace.

Click Edit

The click Edit

Then Click Edit again

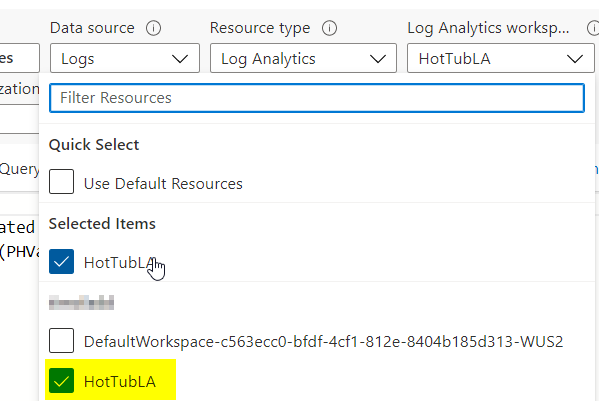
Now click Change

Under Log Analytics workspace. Select your log analytics workspace

Click Done Editing

Repeat the process for all of the Red X’s

When you are done all the data should be showing up

Continue Reading

Monitoring a Hot Tub or Pool with Azure Monitor and Azure Log Analytics Part 4 – Alerting

Part 1 – Hardware and Software Setup || Part 2 – Azure Setup || Part 3 – Dashboarding and Workbooks || Part 4 – Alerting || Part 5 – Tips and Tricks

In part 4 we are going to create e-mail alerts to tell us when the water has breached our desired thresholds for water quality.

We are going to setup rules to alert us when

PH is below 7.2 or PH is greater then 7.8More Information

ORP (Chlorine/Bromine Level) is below 650 or is greater than 750. More Information

Temperature is between 95 and 106 (This is for a HotTub)

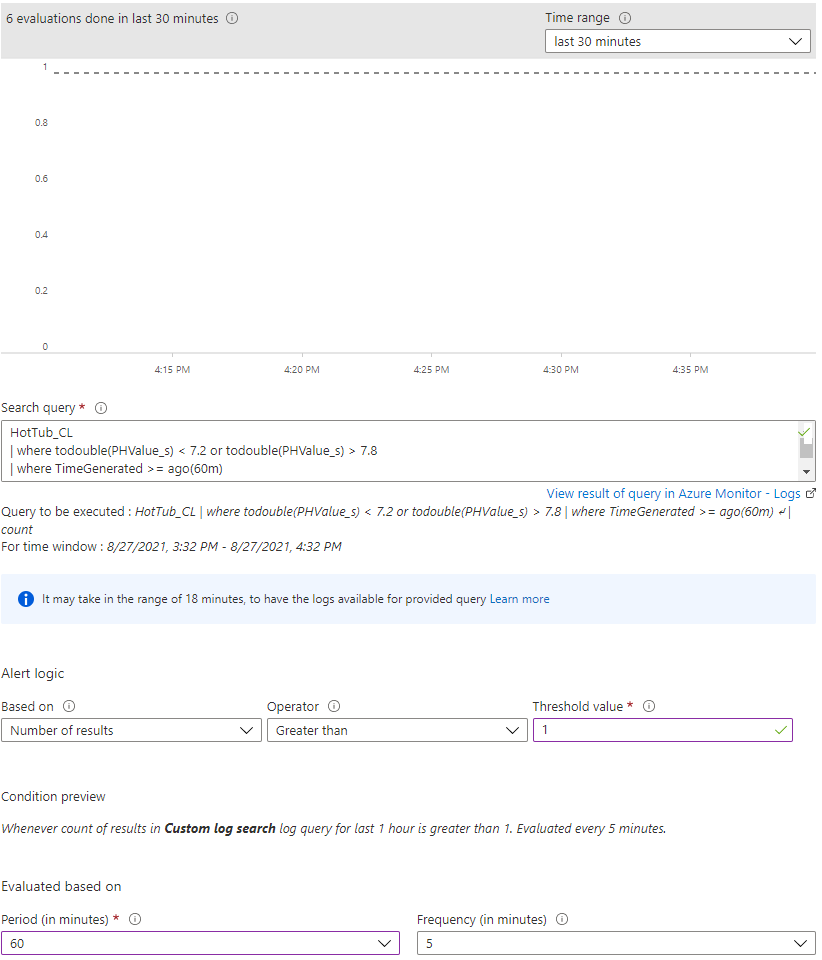
Open up Monitor, Logs. Type in the following query

HotTub_CL
| where todouble(PHValue_s) < 7.2 or todouble(PHValue_s) > 7.8
| where TimeGenerated >= ago(60m)

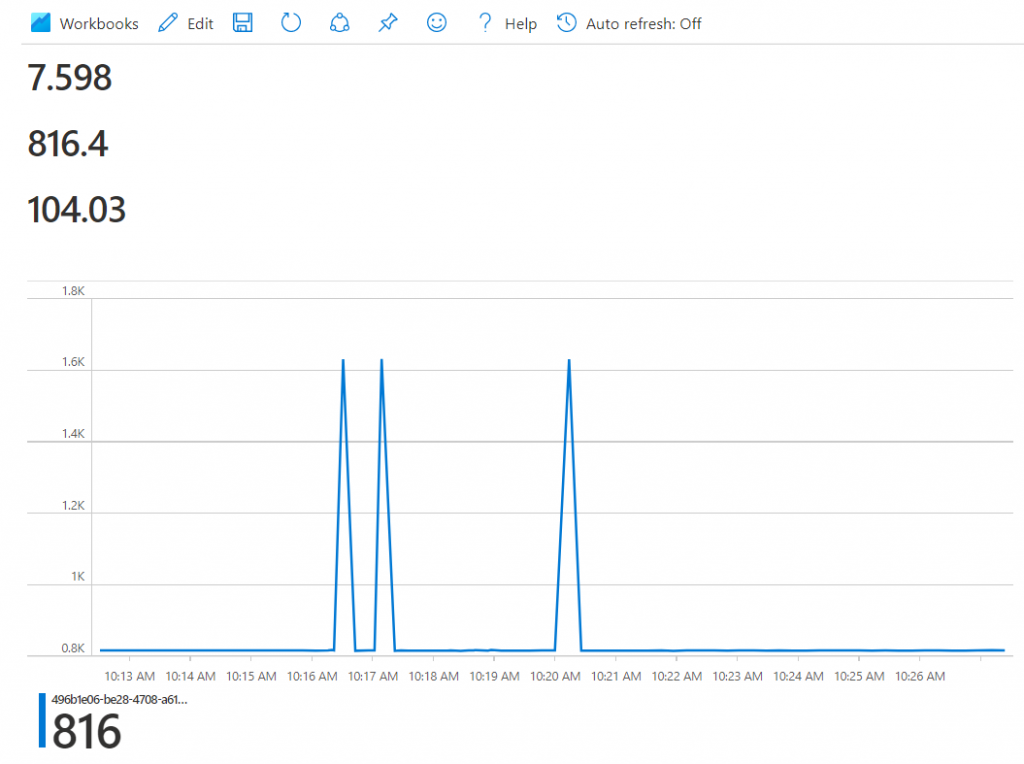
Set the Threshold value to 1 and the Period in minutes to 60. As you can see it won’t create any alerts right now as my current reading for the past 60 minutes has been around 7.6 which is within the range I want to be in.

Click Done, Under Actions select Add Action groups

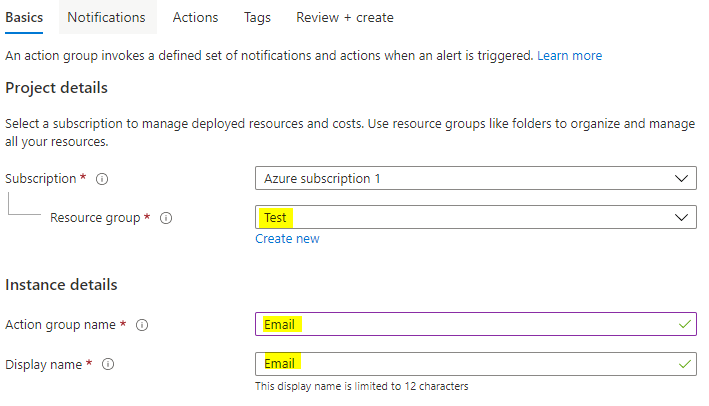
Click Create action group. Set Resource Group, Action group name and display name.

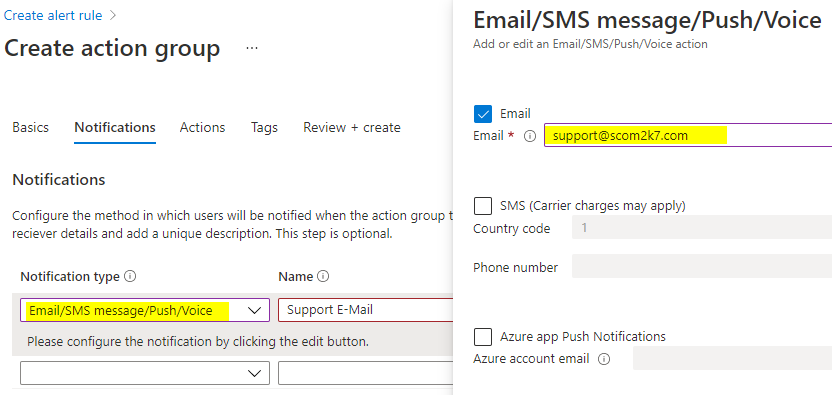
Set you notifications

Click Review + create and then Create

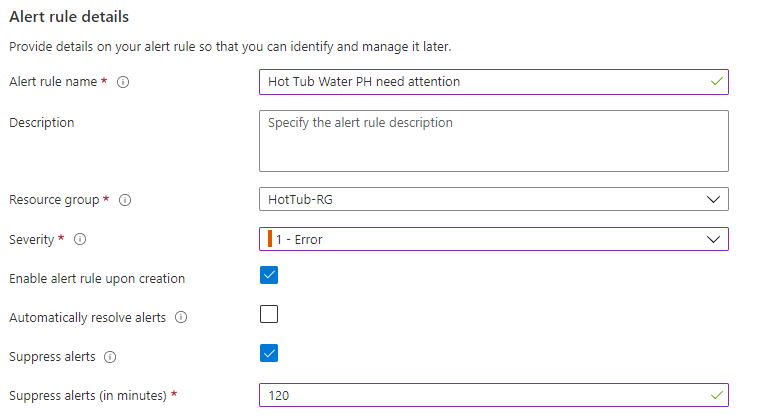
Set the following and click Create alert rule.

Repeat the process for ORP. (No need to create another action group. Reuse the existing one)

Here is the query.

HotTub_CL
| where todouble(ORPValue_s) < 650 or todouble(ORPValue_s) > 750
| where TimeGenerated >= ago(60m)

Repeat the Process for Temperature. Here is the query.

HotTub_CL
| where todouble(TempValue_s) < 95 or todouble(TempValue_s) > 106
| where TimeGenerated >= ago(60m)

Here are all my Alert Rules Setup

Now for some final tips and tricks

Monitoring a Hot Tub or Pool with Azure Monitor and Azure Log Analytics Part 5 – Tip and Tricks

Continue Reading

Monitoring a Hot Tub or Pool with Azure Monitor and Azure Log Analytics Part 3 – Dashboarding with Azure Monitor workbooks

Part 1 – Hardware and Software Setup || Part 2 – Azure Setup || Part 3 – Dashboarding and Workbooks || Part 4 – Alerting || Part 5 – Tips and Tricks

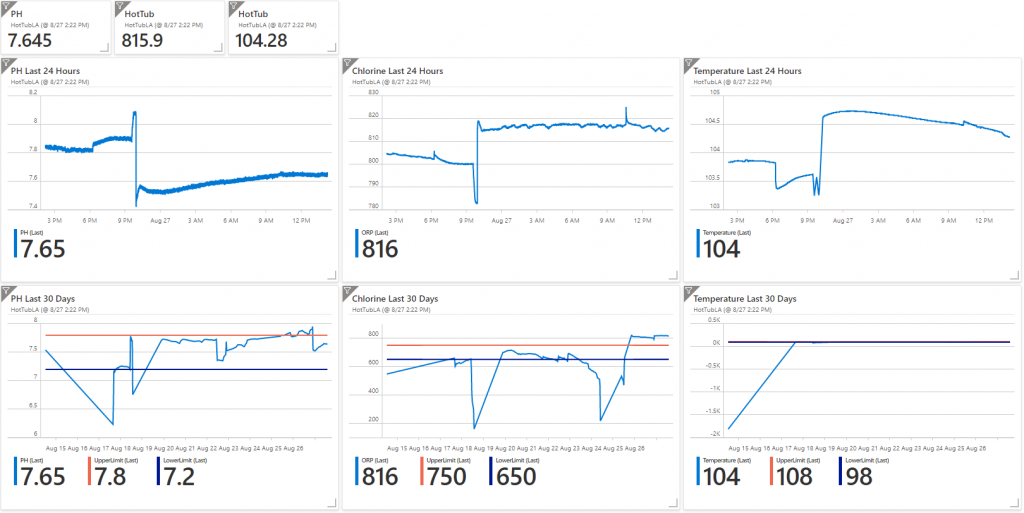
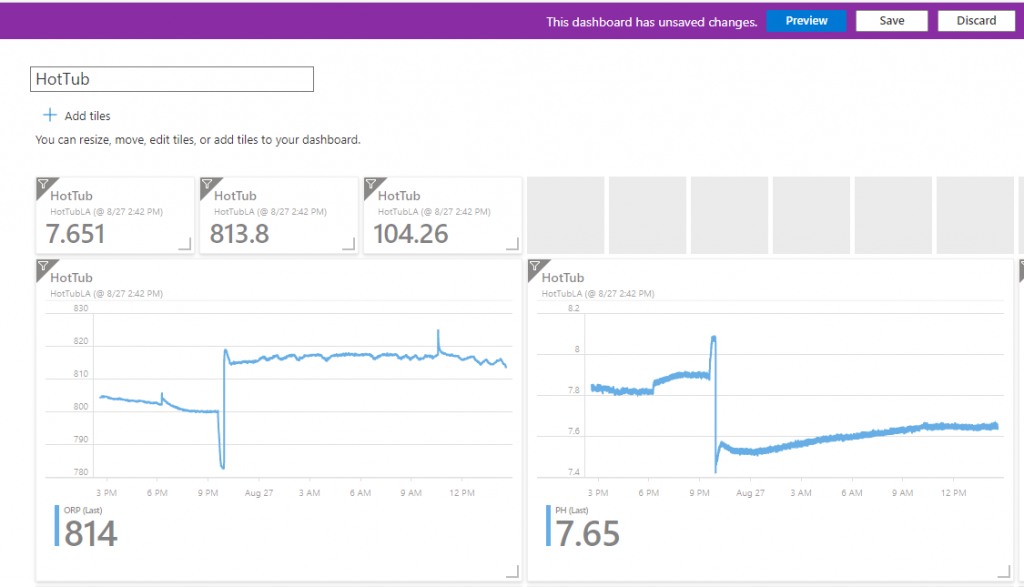
In part 3 we are going to build a dashboard like this to chart out history and progress of our water.

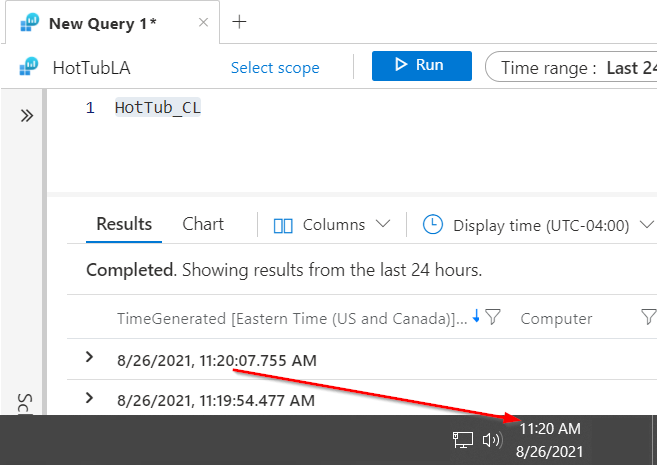
In Azure go to your Log Analytics workspace and verify the data is coming in. In Log Analytics query the HotTub_CL table and check the date time of the last entry and make sure its within a few minutes of the current data time .

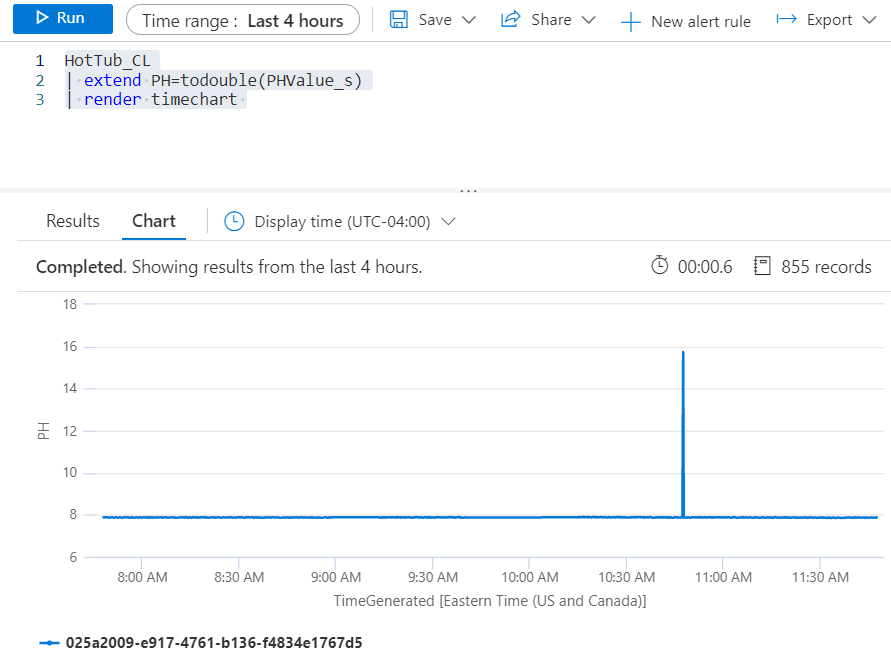
Now lets chart out the data. By default the data is coming in as a string data type. To chart the data we need to change it to a double. Type in the following command to chart out the PH data.

HotTub_CL
| extend PH=todouble(PHValue_s)
| render timechart

It should look like this.

Now lets create some workbooks to show the data. Go to Monitor, Workbooks

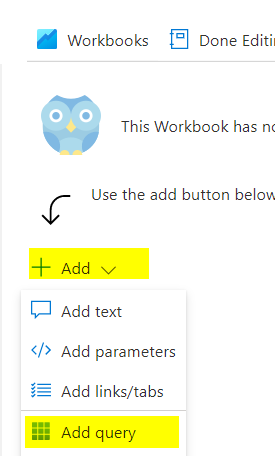
Click Add, Add query

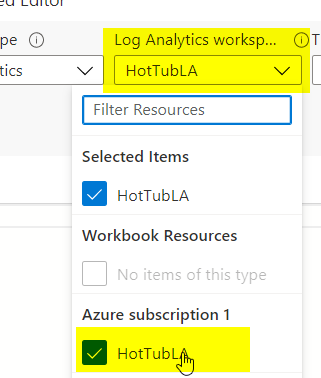
Select your log analytics workspace

Copy and Paste the Query

HotTub_CL
| extend PH=todouble(PHValue_s)
| render timechart

Change the Legend to Last Value and click Done Editing

Repeat the above process to create the ORP and Temperature Graphs. Here are their queries

ORP

HotTub_CL
| extend ORP=todouble(ORPValue_s)
| render timechart

Temperature

HotTub_CL
| extend Temperature=todouble(TempValue_s)
| render timechart

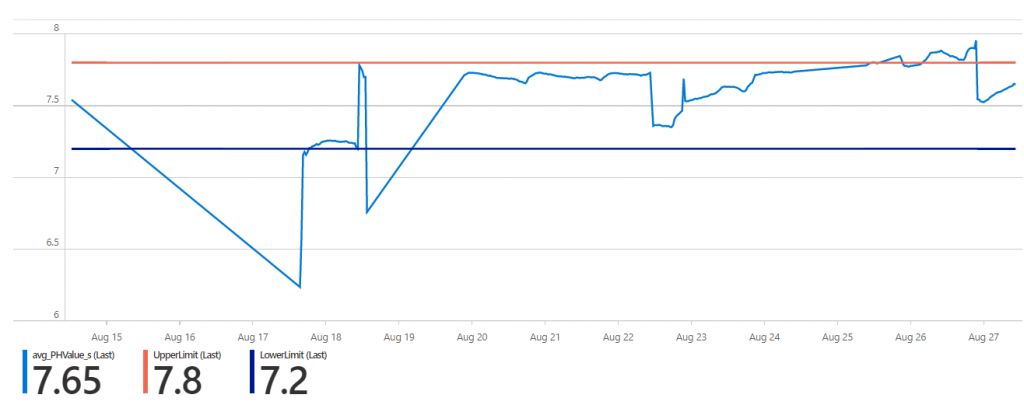
Now I would like to chart out the data over the last 30 days. I also want to set some visual thresholds. For PH anywhere between 7.2 and 7.8 is good.

Here is my query for PH for the last 30 days. This query uses the bin function to round the data to 30 minute intervals, if I tried to use all the data points for the last 30 days the chart wouldn’t render.

HotTub_CL
| where TimeGenerated > ago(30d)
| summarize avg(todouble(PHValue_s)) by bin(TimeGenerated , 30m)
| order by TimeGenerated desc
| extend UpperLimit = 7.8
| extend LowerLimit = 7.2
| render timechart

You can download the entire workbook and Import it into your Azure environment.

Link Click Code, Download Zip

**Note** See Part 5 – Tip and Tricks for how to import and configure the workbook to work in to your environment.

Now that we have all of the charts created lets add them to an Azure Dashboard.

In the portal go to Dashboard.

Give the Dashboard a name like HotTub and click Save.

Now click Share

Then click Publish. This will make it easier to find later.

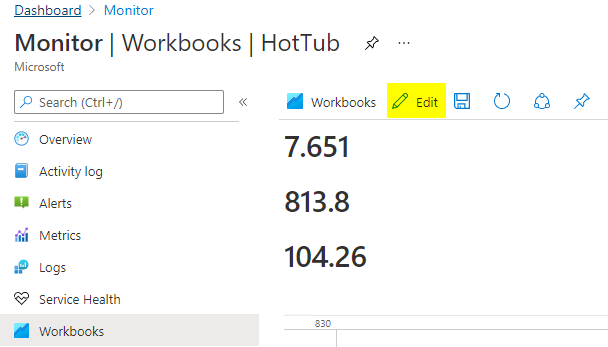
Go back to the HotTub workbook under Monitor, Workbooks. Click Edit

Now click the Pin and select Pin All. (**IMPORTANT** If you don’t click Edit first you won’t get the option to Pin All and your charts won’t show up correctly)

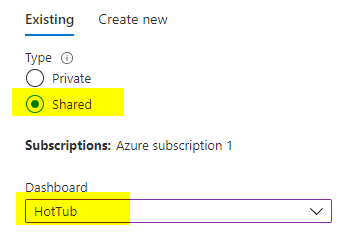
Select Shared and Select the HotTub Dashboard.

Click the Pinning succeeded to go to your dashboard

It will bring in all your charts and values. Now we have to clean up the dashboard so it looks nice. Click Edit and start resizing and moving tiles around

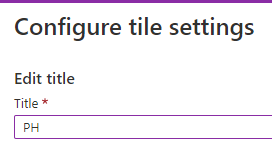
To change the headings. Click the … when you hover over a tile and click Configure tile settings

When you give it a name it will replace the HotTub name at the top of the tile.

Click Save when you are done. You should now have a complete dashboard.

Next lets setup some alerting so we don’t have to stare at the dashboards all day.

Monitoring a Hot Tub or Pool with Azure Monitor and Azure Log Analytics Part 4 – Alerting

Continue Reading

Monitoring a Hot Tub or Pool with Azure Monitor and Azure Log Analytics – Part 2 – Azure Setup

Part 1 – Hardware and Software Setup || Part 2 – Azure Setup || Part 3 – Dashboarding and Workbooks || Part 4 – Alerting || Part 5 – Tips and Tricks

In Part 2, we are going to hookup the hot tub / pool sensors into Azure using Azure Monitor and Log Analytics

Create a Log Analytics Workspace in Azure.

If you don’t already have a MSDN account you can create a free trial account with a $200 credit at https://azure.microsoft.com/en-us/free

Once you have an Azure account go to http://portal.azure.com and click Create a resource

Search for “Log Analytics Workspace

Click Create

Under Create Log Analytics workspace. Type in the following

Resource group: HotTub-RG

Name: HotTubLA

Under Pricing tier leave the default Pay-as-you-go (Per GB 2018)

Click Review + Create and then click Create.

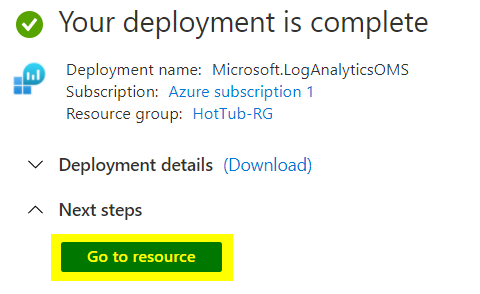
Once Deployment is Complete. Select Go to resource

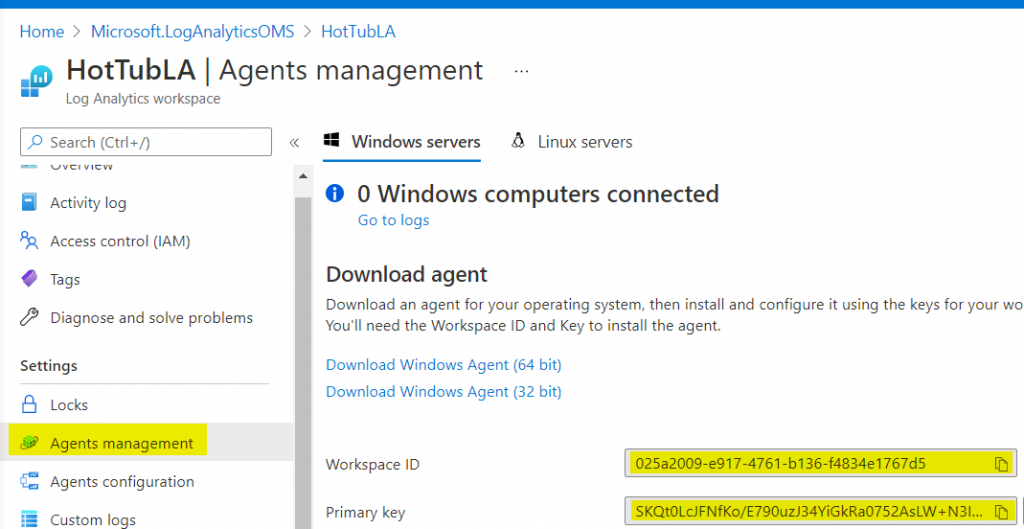
In the Log Analytics workspace we need the Workspace ID and Primary Key. Click Agents management. Copy this information to notepad for use later.

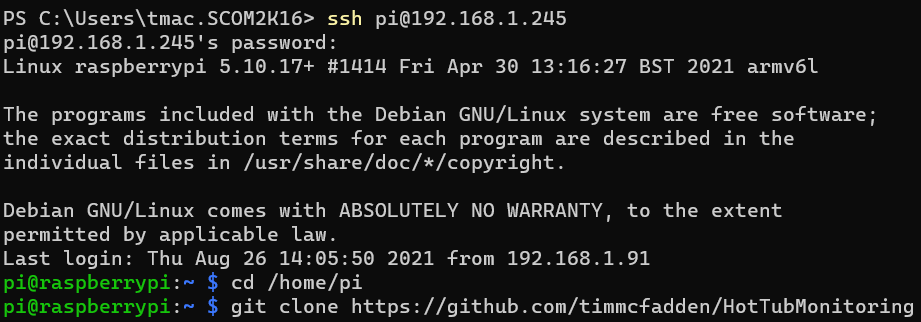
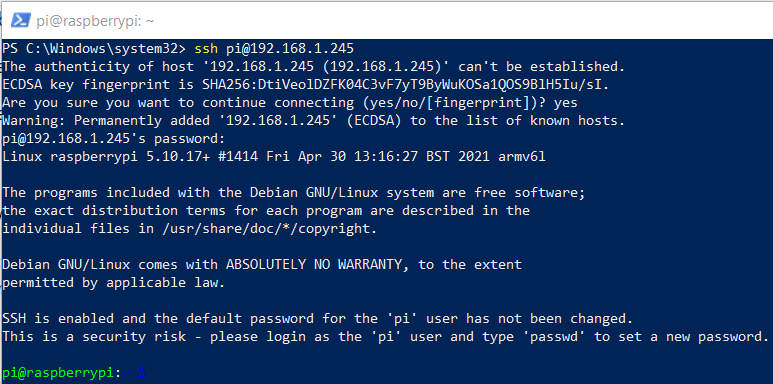
Log into your Raspberry PI device with Powershell and SSh.

Go to home directory

cd /home/pi

Type in this command to install the git repository

git clone https://github.com/timmcfadden/HotTubMonitoring

change directory to HotTubMonitoring

cd HotTubMonitoring

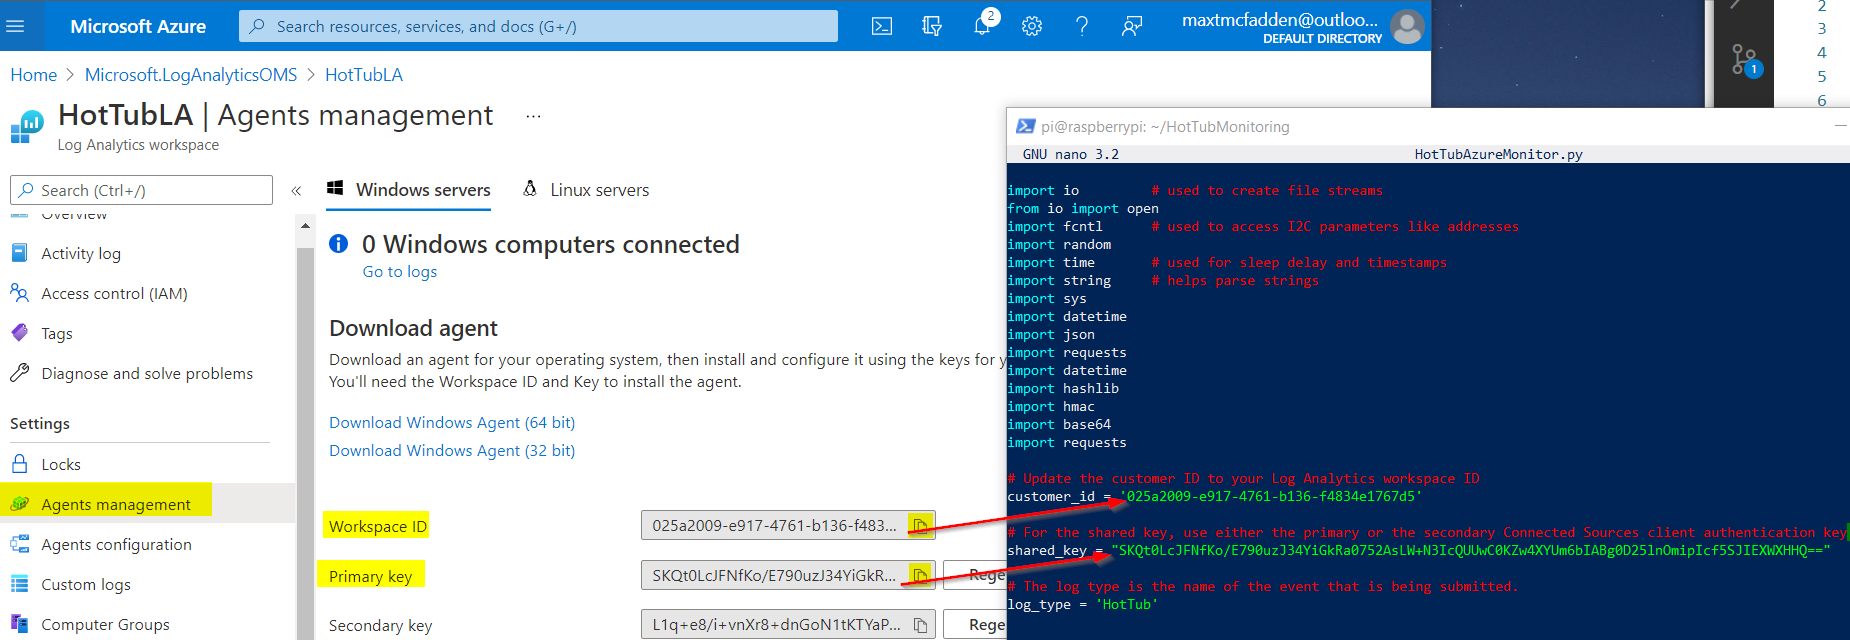
open up HotTubAzureMonitor.py in nano

sudo nano HotTubAzureMonitor.py

Copy and paste your Workspace ID from Azure to the customer_id. Copy and paste your Primary key to shared_key

Control-x to Exit

Y to Save modified buffer and click enter

Now lets test the python code. Type in:

python3 /home/pi/HotTubMonitoring/HotTubAzureMonitor.py

If everything is setup correctly you should see the values from the sensors and Accepted

It can take 5-10 minutes for the data to initially show up in Log Analytics.

Go back to Azure and your Log Analytics workspace an verify the data is making it to Azure.

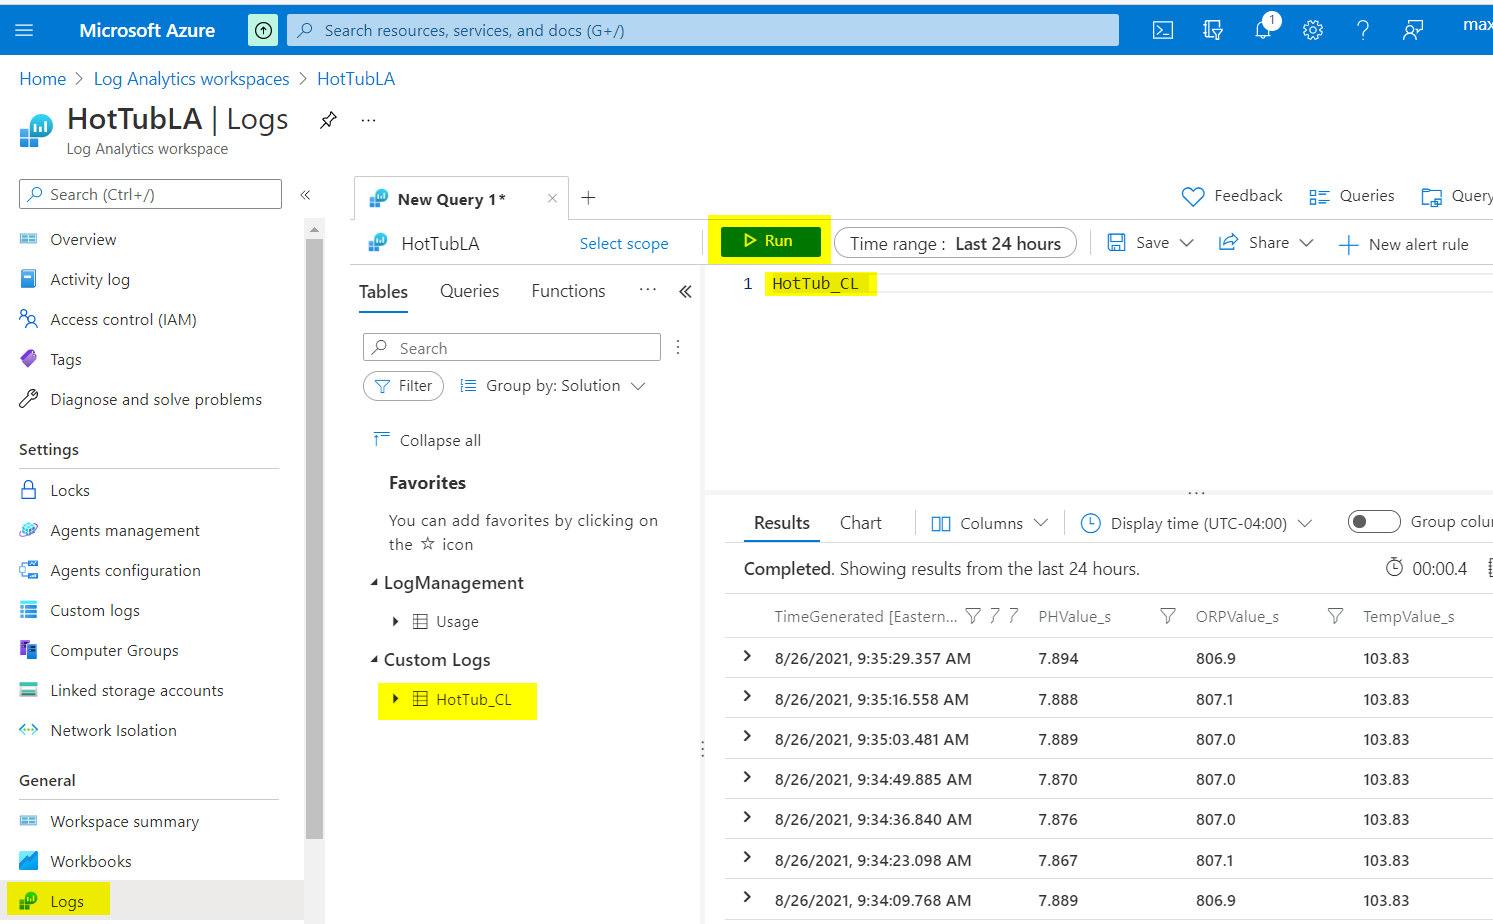
Click on Logs, Expand Custom Logs, and Double click on HotTub_CL and click Run

As you can see we have the data flowing in to Log Analytics.

Now lets setup our Raspberry Pi to run the Python code at startup and run it as a background task so it runs all the time.

Control + C to exit out of the running python code.

Type in

sudo nano /etc/rc.local

Add the following text to the beginning of the rc.local file.

python3 /home/pi/HotTubMonitoring/HotTubAzureMonitor.py &

It should look like this.

Exit out Control + x and Y and Enter to save

Now Reboot the Raspberry Pi

sudo reboot

After it reboots log back into the Raspberry Pi

Now type in

ps -ef

You should see the process in the list that looks like this. This process will run in a loop collecting data. If it ever stops for whatever reason you can simply reboot the device (even just pull the power) and it will start back up at startup.

exit out of the raspberry pi by typing

exit

Now lets setup some Dashboards in Azure so we can see the data anytime.

Monitoring a Hot Tub or Pool with Azure Monitor and Azure Log Analytics Part 3 – Dashboarding with Azure Monitor workbooks

Continue Reading

Monitoring a Hot Tub or Pool with Azure Monitor and Azure Log Analytics – Part 1 – Hardware and Software Setup

Part 1 – Hardware and Software Setup || Part 2 – Azure Setup || Part 3 – Dashboarding and Workbooks || Part 4 – Alerting || Part 5 – Tips and Tricks

Are you having trouble keeping your Hot Tub or Pool water balanced? Are you wasting time checking to see if their is enough chlorine/bromine in your hot tub or pool everyday? Do you want to know the temperature of your pool or hot tub anytime of the day from your phone?

With Azure Log Analytics, a Raspberry PI Zero and some IOT parts you can built an awesome Hot Tub or Pool Monitoring Solution.

Here is the equipment you need:
Raspberry Pi Zero WH (Zero W with Headers) – $14
microSD Memory Card– $7.50
5V 2.5A Power Supply – $7.50
Wifi Pool Kit – $349.99
Jumper Wires – $7.49
Azure Subscription

Hardware

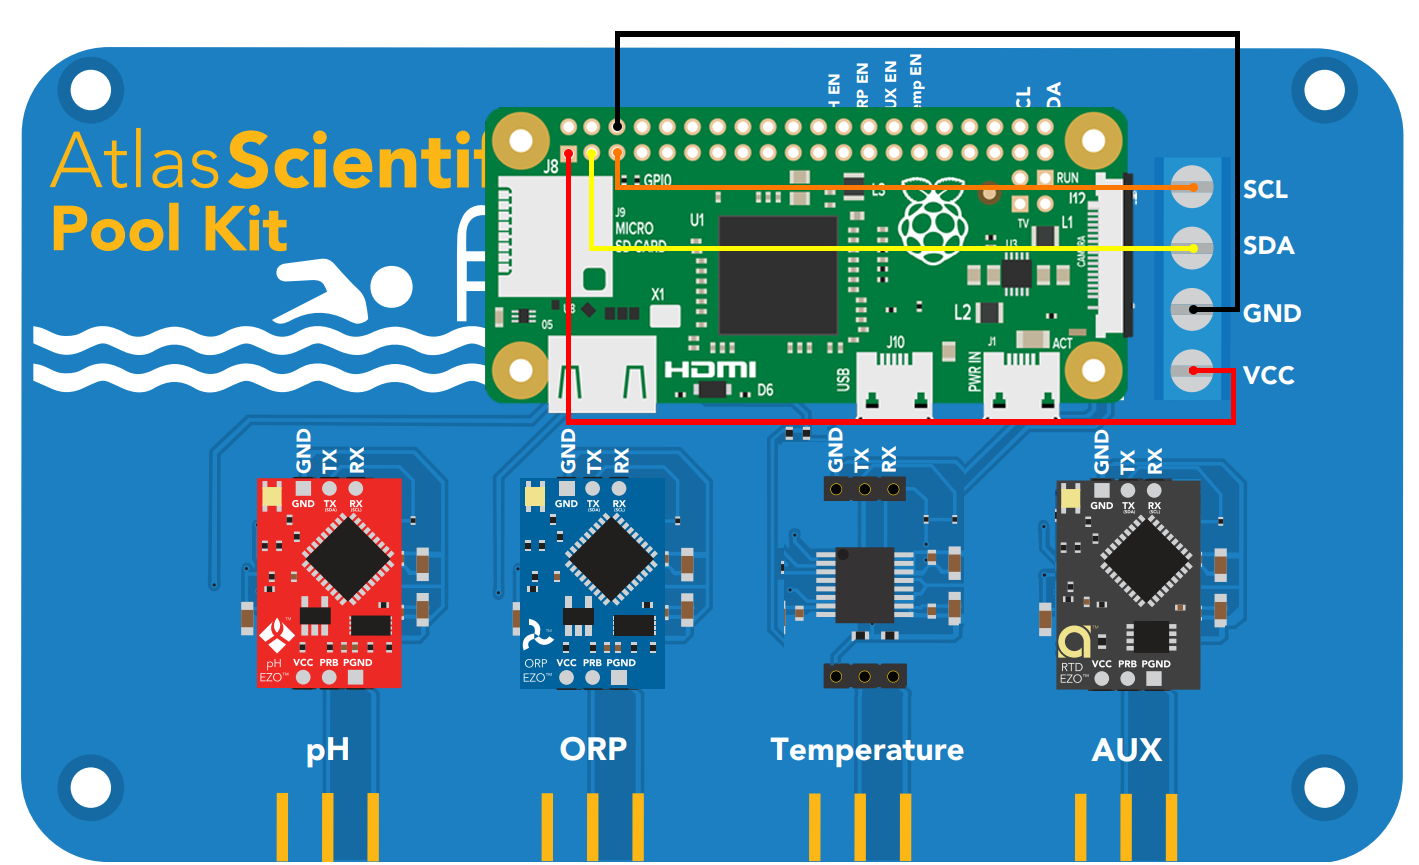
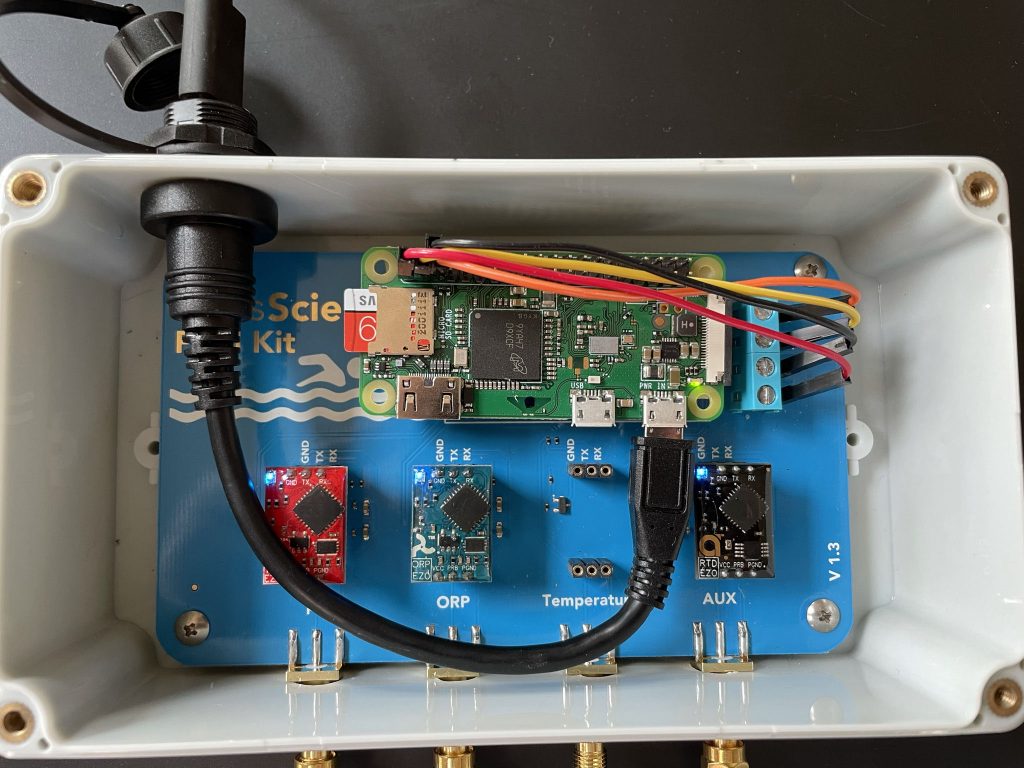
Remove the Arduino board that comes with the Wifi Pool Kit. Attach the micro USB cable to the power port of the Raspberry PI. Attach each of the jumper cables as specified in the drawing. To attach them to the blue board you will first have to loosen the small screws then attach the jumper cable and tighten the screws.

Move the Temperature Chip from the Temperature Slot to the AUX slot. It doesn’t work correctly in the Temperature slot with Raspberry PI

Screw in the PH, ORP and Temperature sensors into their respective ports.
When you plug it in the lights should light up blue if everything is working correctly

Software

First we need to get the Raspberry Pi Zero installed and communicating on your WiFi with SSH.

  • Plug in the microSD Memory card in your computer. (If you don’t have a slot in your computer you will need a microsSD usb reader or another computer that has one)
  • Download the Raspberry PI Imager Link
  • Run the Raspberry PI Imager.
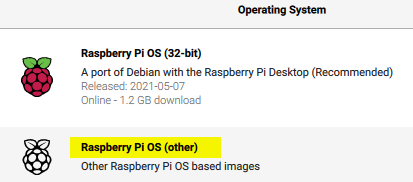
    • For Operating System choose Raspberry Pi OS (other)
  • Then choose Raspberry Pi OS Lite (32-bit)
  • Choose your MicroSD card for Storage and Click Write
  • REMOVE AND REINSERT THE MICROSD CARD – This step is only necessary because Raspberry PI Imager automatically unmounts the SD card.

Before we put the microSD card into the Pi, we’ll need to edit some files.

  • In the root of the microSD drive, create a file called ssh (make sure there is no file extension). This file will enable SSH on the Pi. You can create a empty txt file called ssh.txt and remove the txt extension. You might need to click view and select File Name Extensions to remove the file extension.
Create a file called wpa_supplicant.conf and copy the code below changing the ssid and psk to your wifi name and password. Save this file to the root of the microSD drive as well. This is a configuration file that will allow you to pre-configure the WiFi credentials. On boot, the Pi will copy and use this as the default configuration file.

country=US
ctrl_interface=DIR=/var/run/wpa_supplicant GROUP=netdev
update_config=1

network={
ssid="YOUR_WIFI_SSID"
scan_ssid=1
psk="YOUR_WIFI_PASSWORD"
key_mgmt=WPA-PSK
}


Please double check and verify the WiFi credentials. If not, the next step will be hard.

Remove the MicroSD card from your computer and place it in the RaspberryPI Zero.

We need the IP address of the Raspberry Pi. To find out the IP address you can either log into your router and look for a computer connected to your network called raspberrypi. You an also use a IP scanning tool like Advanced IP Scanner

Now that we have the IP address we can SSH into the Raspberry PI. The default login is

UserName: pi
Password: raspberry

To login to the device using windows 10 open up Windows PowerShell (Right Click Run as administrator)

Type in ssh pi@yourIpAddress

Run the following command in the terminal.

sudo apt-get install python-smbus
sudo apt-get install i2c-tools

Once those have finished installing run

sudo raspi-config

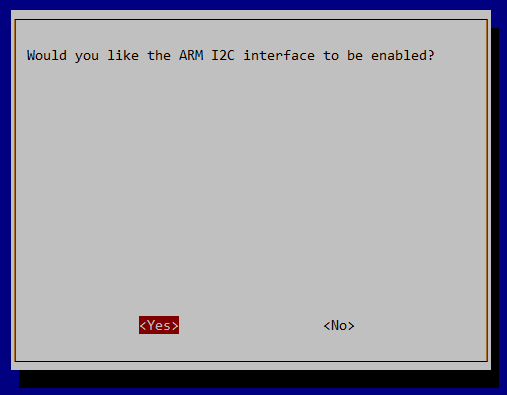
You should see a blue screen with a grey box with options. Select 3 Interface Options. Click Enter

Next choose P5 I2C Enable/disable automatic loading of I2C kernel module. Click Enter

Choose Yes. Click Enter

Click Ok on the next screen then go down to the bottom of the screen and click Finish.

Reboot the Raspberry Pi

sudo reboot

Now with the raspberry pi is setup to communicate with the sensors lets test it out.

Log back into the raspberry pi with SSH using PowerShell.

Install git

sudo apt-get install git

Download the sample code

git clone https://github.com/AtlasScientific/Raspberry-Pi-sample-code.git

CD into the Raspberry-Pi-sample-code directory

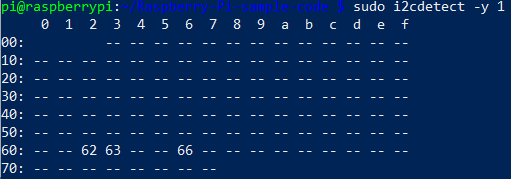
Run the following code to make sure your devices are showing up. If you don’t see them then check the connection to the Raspberry PI and the Blue Board.

sudo i2cdetect -y 1

Run the following command to bring up a test command interface

sudo python i2c.py

Then in the enter the following command. This will start polling all three interfaces.

Poll,2.0

Control-c to exit the polling and Control-c to exit the script.

Now lets hook it up to Azure Monitor and Log Analytics.

Monitoring a Hot Tub or Pool with Azure Monitor and Azure Log Analytics – Part 2 – Azure Setup

Continue Reading

Introducing the SCOM To ServiceNow Connector

Features:

  • Easy to Use – Select the SCOM Monitor or Rule you want to send to ServiceNow. All future alerts from that Monitor or Rule will be sent to ServiceNow.
  • Send alerts based upon SCOM Groups to ServiceNow
    • Send all logical disk free space alerts created from computers in the SQL Team’s SCOM Group to the SQL Teams Incident Assignment Group in ServiceNow.
    •  Send all logical disk free space alerts created from computers in the Exchange SCOM Group to the Exchange Teams Incident Assignment Group in ServiceNow.
  • SCOM Console Tasks
    • Select any alert in SCOM and instantly send it to ServiceNow.
    • Quickly identify the rule or monitor that created the SCOM alert to send future alerts to ServiceNow.
  • Save Money – No extra ServiceNow tables required to filter SCOM alerts

Download

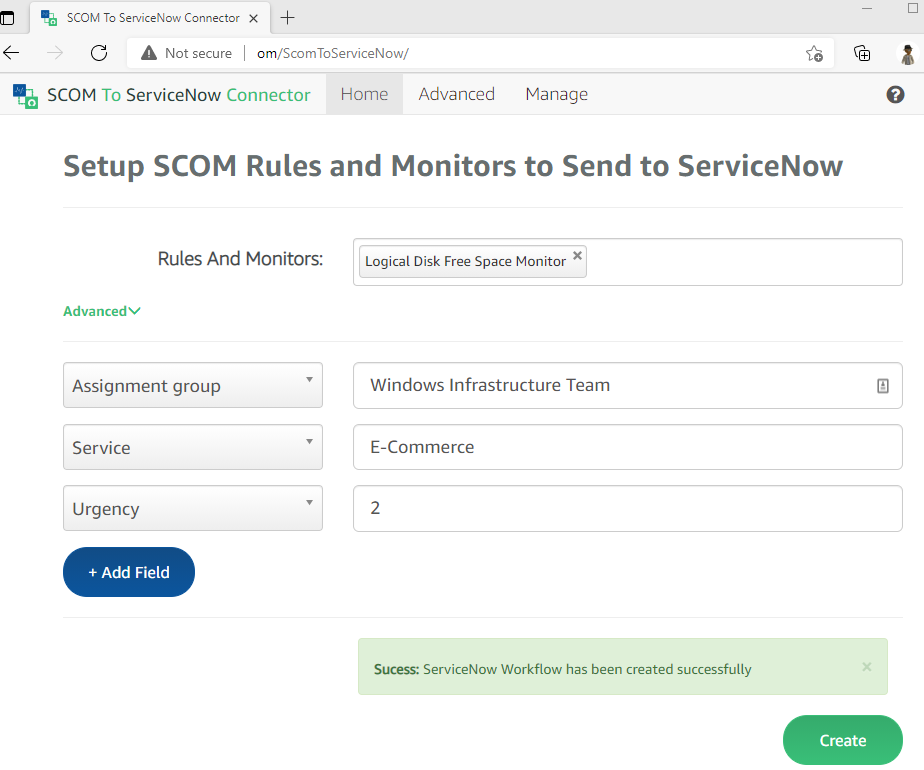
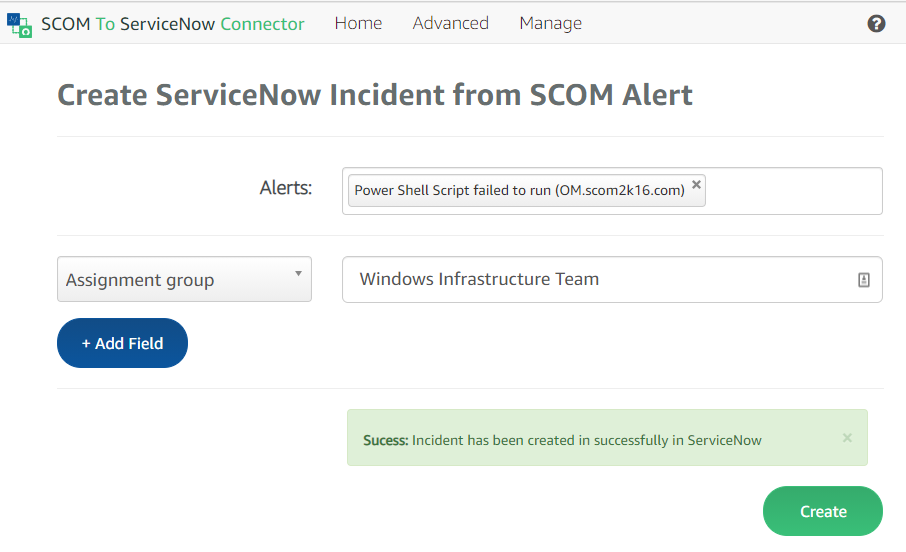
Select the SCOM Monitor or Rule you want to send to ServiceNow. All future alerts from that Monitor or Rule will be sent to ServiceNow.

SCOM To ServiceNow Connector Screenshot

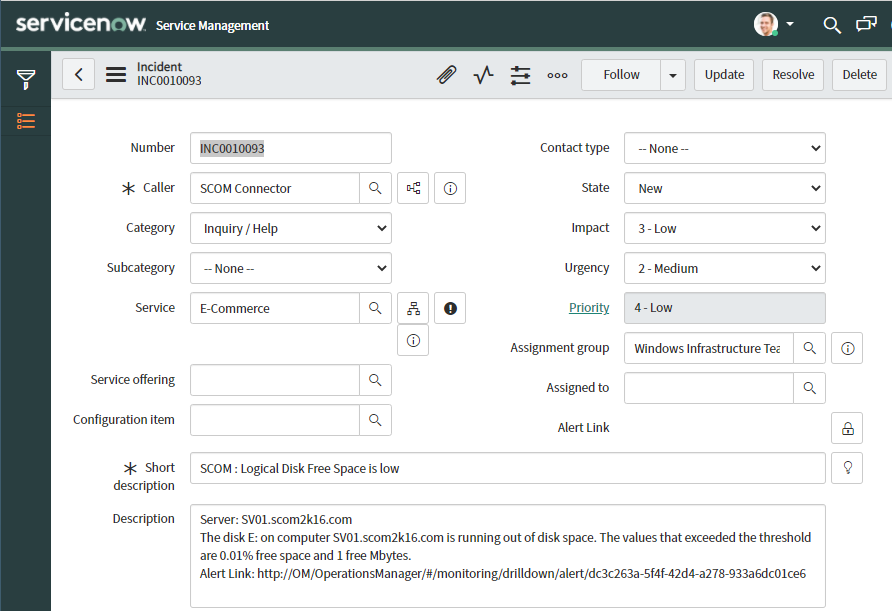
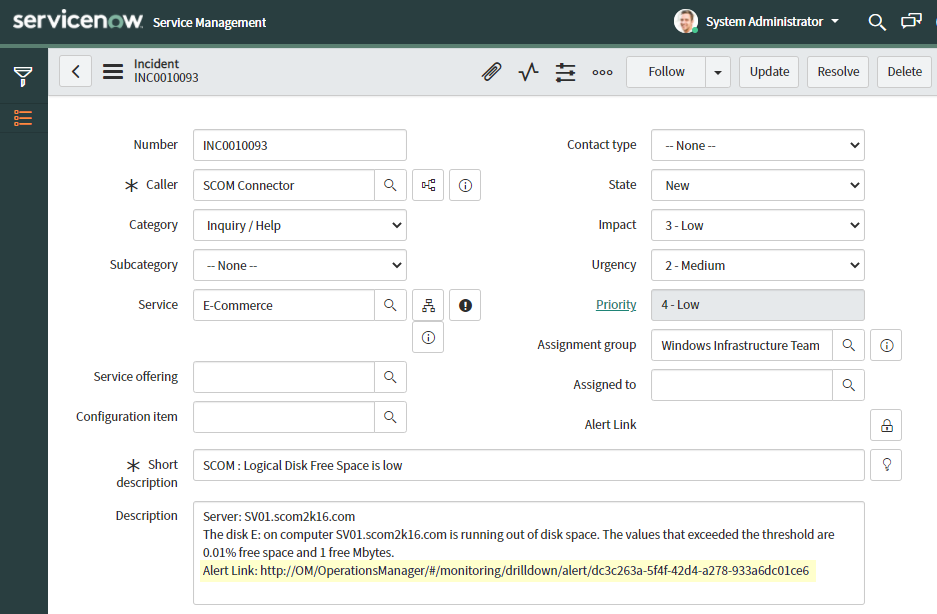
When a logical disk free space alert is triggered in SCOM. The alert is created in ServiceNow.

Send alerts based upon SCOM Groups to ServiceNow

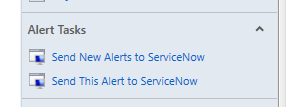
SCOM Console Tasks – Select any alert in SCOM and instantly send it to ServiceNow

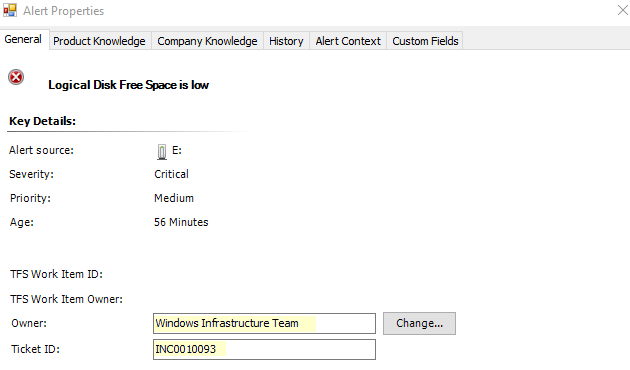
SCOM Alerts sent to ServiceNow automatically get the ServiceNow Ticket ID and the Owner is set to the Assignment Group.

Alerts in ServiceNow have the Web Console Link in the description if the SCOM Web Console is installed.

How to Use the SCOM To ServiceNow Connector Videos

Continue Reading

Copy SCOM monitors inside sealed management packs

Have you ever wanted to copy a monitor inside of a sealed management pack? For instance copy the Microsoft Logical Disk Space Monitor and make it work the way you want to.

On the surface this seems extremely difficult because there is no copy button inside the console. But it is actually is not too difficult.

Normally you would need to extract the XML from the sealed management pack and find all the dependencies for that monitor.

With MP author free and pro you are able to make a copy of the monitor.

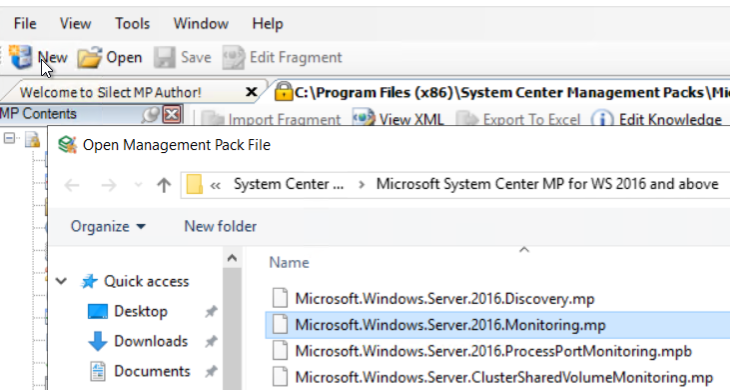
Once you have MP Author downloaded then you can open up the sealed management pack

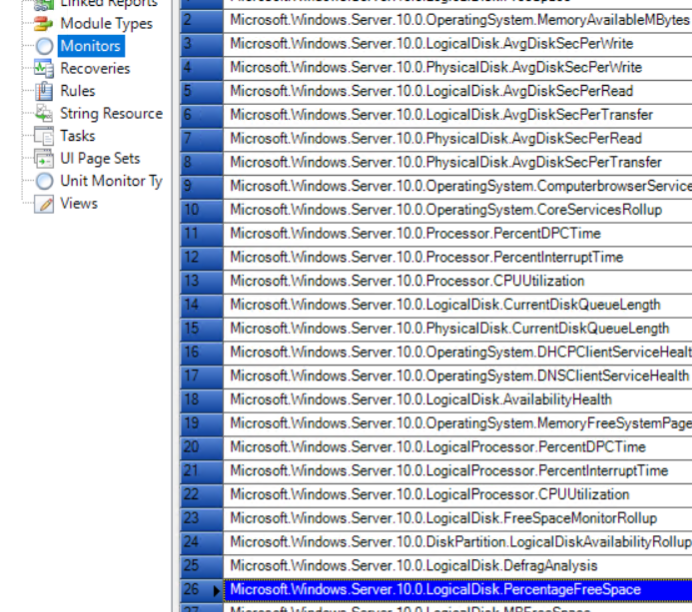
Select the monitor you want to copy.

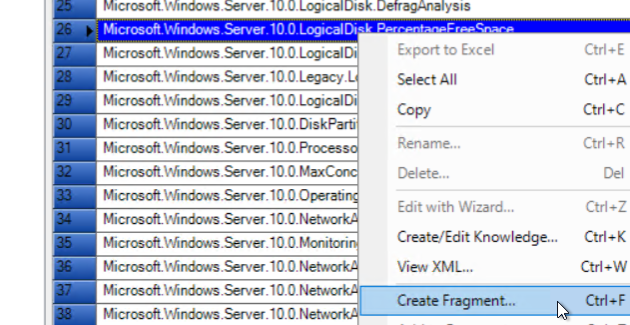
Right click on the monitor and create fragment.

Click Save As and save to your local computer.

Before you close MP Author you will want to copy the Target as MP Author will automatically change the target to a variable.

Now let’s open up the mpx file or management pack fragment in Notepad++

Find and replace the text “##ClassID##” with the target ID that we copied earlier.   In my case it was “Microsoft.Windows.Server.10.0.LogicalDisk”

Now you have a complete copy of the monitor with all the dependencies.  To use this management pack fragment we will need to create a new management pack either in visual studio or in MP author pro.

One thing I wasn’t aware of until recently was that you don’t need to change the class names.  All ids in a management pack need to be unique inside the management pack, but they do not need to be unique inside of SCOM.  The management pack id acts as a namespace if you are familiar with programming.

For Information on how to build a management pack with Visual Studio and the management pack fragment we just created click the links below.

Visual Studio: Authoring Management Packs – the fast and easy way, using Visual Studio??? – Kevin Holman’s Blog

MP Author Pro:   https://www.youtube.com/watch?v=IGFoh2qcUJ4

Continue Reading