Monitoring a Hot Tub or Pool with Azure Monitor and Azure Log Analytics Part 5 – Tip and Tricks
Part 1 – Hardware and Software Setup || Part 2 – Azure Setup || Part 3 – Dashboarding and Workbooks || Part 4 – Alerting || Part 5 – Tips and Tricks
In Part 5, I have a couple tips and tricks.
I don’t like the idea of having a plug near my Hot Tub so I purchased some of these connectors to go from SMC to BNC.
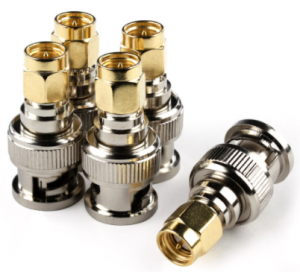
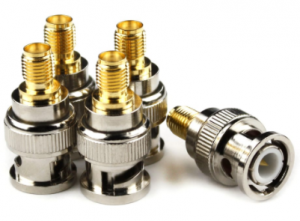
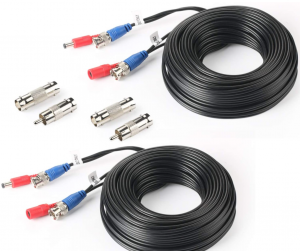
Then I ran 3 33ft standard BNC cables from my basement to my raspberry PI to the sensors in my hot tub.
After a while my ORP and PH sensors wore out after being submerged in water for over a year.
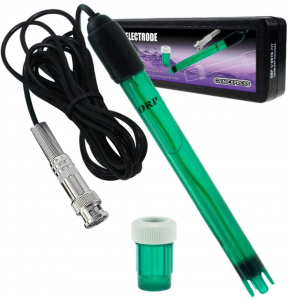
I purchased this cheaper ORP sensor that works better and last longer. Link
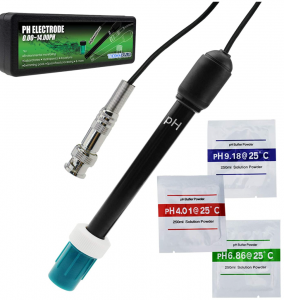
I also switch to this PH Sensor. Link
How to import the workbook into Azure.
Download the workbook from https://github.com/timmcfadden/HotTubMonitoring
Open up the HotTub.workbook in Notepad++ or VSCode
Copy out the JSON.
Create a new workbook in Azure Workbooks.
Click Advanced Editor

Leave it on Gallery Template and Paste in the JSON code and click Apply.
You will see a bunch of red X’s. We need to change to your Log Analytics workspace.

Click Edit
The click Edit

Then Click Edit again

Now click Change
Under Log Analytics workspace. Select your log analytics workspace

Click Done Editing
Repeat the process for all of the Red X’s
When you are done all the data should be showing up
