You might have noticed that the SCCM Reporting Dashboard was released. But what most of you don’t know is that you can use the dashboard for SCOM data. The cool thing with the SCCM dashboard is that it’s and OPEN platform. You can feed it a SQL query and it will display a live gauge or a graph. This can be used query data from the SCOM Operations DB, the Data Warehouse DB or any DB you want.
So how do we do it?
First we need to download and install the SCCM dashboard. You can download it at http://www.microsoft.com/downloads/details.aspx?displaylang=en&FamilyID=27fe0d80-38c6-464a-953a-1c2edcf35c2d
Install the dashboard using the guide that comes with the download.
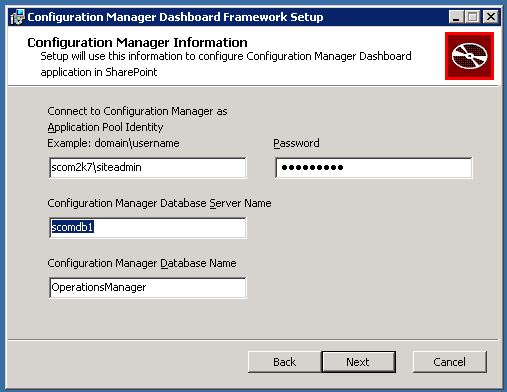
** If you don’t have SCCM that’s ok. The install is just asking for a database. So just type in the name of the Operations Manager Database. Make sure the username and password has permissions or the install will fail.
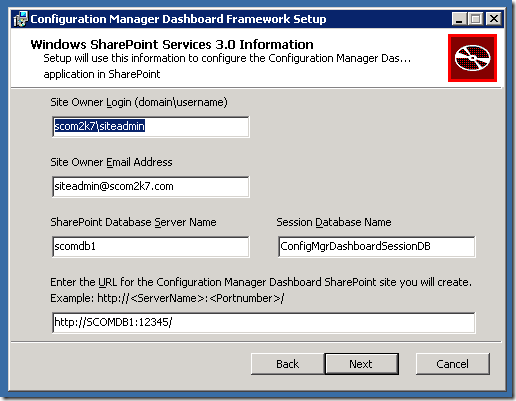
Input the information from the SharePoint installation.
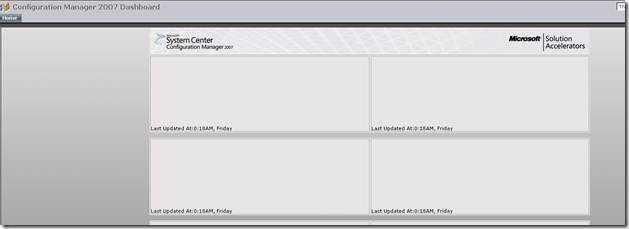
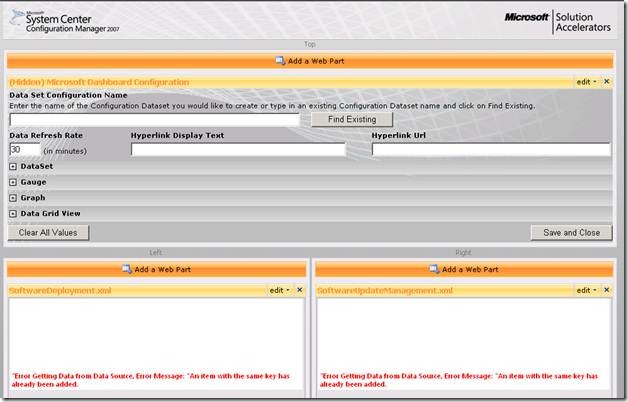
After it’s installed your dashboard will look blank like this. That OK it’s just because it doesn’t have any data to pull from. So lets give it some data.
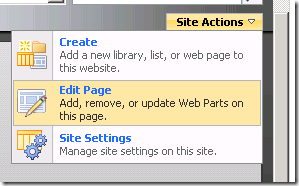
Go to Site Actions Edit Page
You should now see this configuration editor
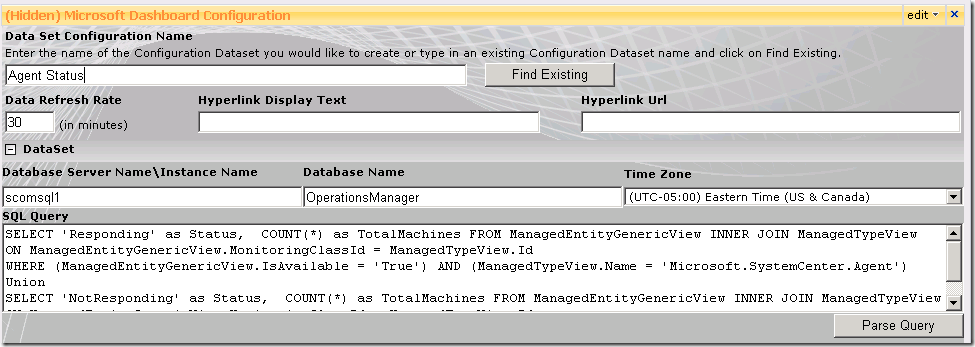
Enter in a Name for the data and then enter in SQL Server and Database Name
Then input a SQL query that you want to graph.
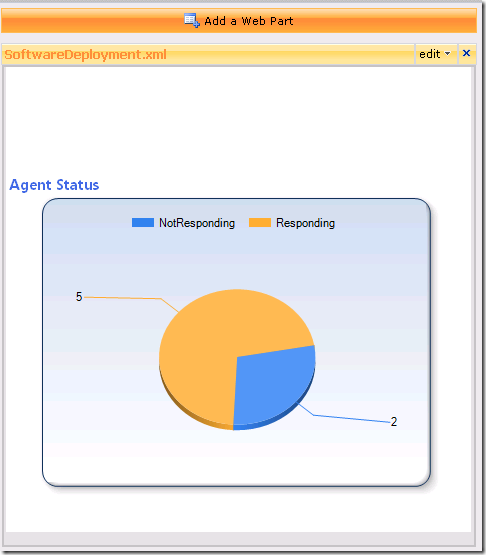
Here is the query I used to return back # of Agents Responding and # of Agents not responding.
SELECT ‘Responding’ as Status, COUNT(*) as TotalMachines FROM ManagedEntityGenericView INNER JOIN ManagedTypeView
ON ManagedEntityGenericView.MonitoringClassId = ManagedTypeView.Id
WHERE (ManagedEntityGenericView.IsAvailable = ‘True’) AND (ManagedTypeView.Name = ‘Microsoft.SystemCenter.Agent’)
Union
SELECT ‘NotResponding’ as Status, COUNT(*) as TotalMachines FROM ManagedEntityGenericView INNER JOIN ManagedTypeView
ON ManagedEntityGenericView.MonitoringClassId = ManagedTypeView.Id
WHERE (ManagedEntityGenericView.IsAvailable = ‘false’) AND (ManagedTypeView.Name = ‘Microsoft.SystemCenter.Agent’)
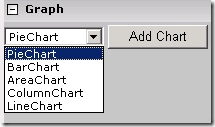
Now choose the type of graph you want. I choose PieChart
Give it a Title
Then Choose Save and Close
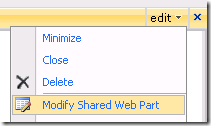
Now go to one of the Web Parts and Select edit Modify Shared Web Part
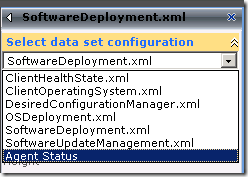
In the top corner under “Select data set configuration”, select the data set we just created. Then click OK
The Agent Status should now show up in the web part.
Click Exit Edit Mode in the top right corner
Repeat the process with any other data set you want to display in a graph or gauge.
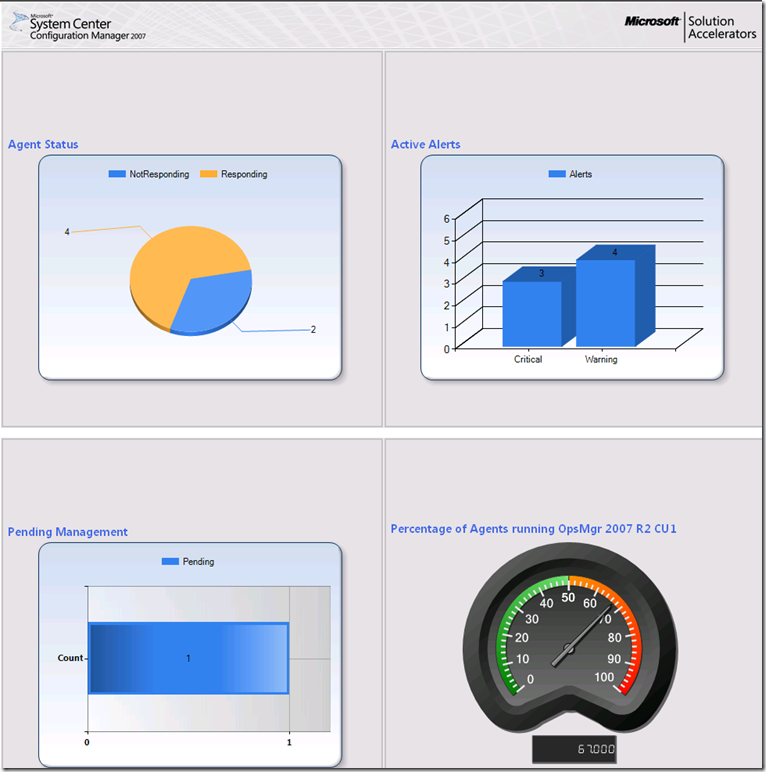

This is really cool..
But more detailed steps on the setup would be helpful..
I tried, but didn’t work for me..:( ( I am sure its my test scom servers issue)
All the steps to get the SCCM dashboard working are in the install guide. Please refer back to that for more details.
This is and excellent and creative use for the dashboard. I have set this up against a test SCCM database and it works great. I am now trying to get it to work against a SCOM database. I’ve given the application pool account db_owner role to the OperationsManager database and I still can’t parse or validate the query above. Thanks!
I am trying to create a new query (for SCCM not SCOM) on the dashboard and I keep getting an error “Selected values for x and y axis should not be the same.” I understand the concept of this error but when I’m configuring the new webpart, it only asks me for the y-axis value…am I missing something?
Hey
Really glad to get into this forum
It’s what I am looking for.
Hope to know more member here.
What was the SQL queury you used to get the percentage of Agents with a particular hotfix?
Tim,
Nice Article about SCOM Dashboard, I am trying to install it at my place but I am running into issues. I have installed all the prerequisites still the install fails and roll backs. I am not able to install it. Can you please help me to setup the dashboard?
This is and excellent and creative use for the dashboard. I have set this up against a test SCCM database and it works great. I am now trying to get it to work against a SCOM database. I’ve given the application pool account db_owner role to the OperationsManager database and I still can’t parse or validate the query above. Thanks!
Hello,
It is excellent. I used the query above after changing the quotes (retying them) and it works. Now I was also able to add the web part AgentStatus and it is displayed during the Modify Shared Web part but after I do Apply and/or Ok and Exit it disappears…. (:
Thanks,
Dom
After some non-intuitive actions I have a beautiful dashboard
Thanks
Dom
hello,
All looks good after refreshes and refreshes…
Some questions:
– is it possible to have several color in a Bar Chart?
– Where are the settings for the refresh time of the dashboard?
Thanks,
DOm
I found out the refresh time for the dashboard… still in progress for the change in the color for the graph(s)…
Hello,
another question, is it possible to remove the .000 in the Gauge counter?
Thanks,
Dom
One more… 🙂
How to remove the “Show Filter” or “Hide Filter”?
Thanks,
Dom
Hello,
Is there anyway to have site and sub site linked together in the dashboard?
Thanks,
Dom
Hello,
Remaining questions on the SCCM Dashboards?
– How to change colors?
– How Export/Import webparts as for now the .webpart file is inported but what about the datasets?
– How to remove “Show Filter/Hide Filer”?
Thanks,
Dom
Hi,
If I try and use this solution with Sharepoint in Domain A and SCOM in Domain B which ports would I need to open?
Thanks!
Great Article! Managed to grab a whole bunch of different code from around the place, but the following code above gives me an Incorrect syntax near ‘‘’. Ive cut the code in half and just tried responding’, same thing? Im not a SQL guy! 🙁 Any help would be great! The query parses just not validates?
Could you let me know how did you remove/hide the ‘Show Filter’ from this dashboard?
SCOM is like the 1990’s version of monitoring. I would love to see dashboards that more efficiently display data and better utilize the page “real estate” to better represent a collection of related data.