1.) In the Authoring pane, expand Authoring, expand Management Pack Objects, and then click Monitors.
8.) On the Second SNMP Probe for Object Identifier Properties we are going to use the same thing (1 minute Load) “.1.3.6.1.4.1.2021.10.1.3.1” then select next.
9.) On the Build Second Expression for Parameter Name use the same as the first “/DataItem/SnmpVarBinds/SnmpVarBind[1]/Value” for Operator use “Less than or Equal to” and then choose a CPU value that you want to alert on. I choose “1” again for demonstration purposes. Click Next
10.) On the Configure Health Page Change the First Event Raised to Critical
(So what we are saying in this expression is “If CPU is greater then or equal to 1 set it to a critical State” “If CPU it Less than or equal to 1 set it to a Healthy state”’)
11.) On the Configure Alerts click Generate alerts for the monitor
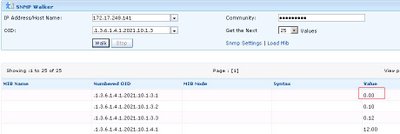
12.) For testing I downloaded a tool called Manage Engine OpUtils 4 http://manageengine.adventnet.com/products/oputils/index.html I think any SNMP Walker tool will do. What I wanted to do I query the current Value of the CPU (or OID for CPU)
As you can it is currently 0.03. So the monitor should be in a healthy state.
13.) Currently there are no active alerts on the console.
Now I went to my ESX box and create some activity. A “vm-support” from an ssh session will create enough CPU activity.
14.) A SNMP walk on the object shows the value above 1


Thanks for the information. However, if I want to have the monitor apply not to SNMP Network Devices, but another group of devices, how to do that? Each time I have tried to define an SNMP Probe Monitor and target it to another group, SCOM just throws up a stack trace error. (I won’t comment on this lack of useful UI feedback).
Hello S,
Yes, there is a glitch with the targeting – what you must do is create the Monitor as per the steps above, target the SNMP Network Device Group, but disable the monitor. Now you use an Override to Enable it for the Group that you want to use it for. This is the only way I could get it to work on Groups other than the default SNMP Network Device Group.
Hope this helps
Many many many thanks Man !!
i’m searching for the “/DataItem/SnmpVarBinds/SnmpVarBind[1]/Value” variable but i never find it on any website.
Thanks a lot !
Hi There,
Many thanks. /DataItem/SnmpVarBinds/SnmpVarBind[1]/Value is the real code required for this monitor t owork was searching for this every where but found it here.