Hello, my name is Mark Drewfs. I am a Premier Field Engineer for Microsoft with a focus on Systems Center Operations Manager. I started building data models of the SCOM Data Warehouse to use for interactive reports, and I would like to share some techniques. Tim McFadden graciously offered to edit the work and host this blog post. Thank you, Tim!
The data SCOM collects and Business Intelligence tools fit well together, but there can be a significant barrier to combining them. Power View lowers that barrier a lot. Users can move quickly between performance counters and go from an enterprise view down to a single server without much effort.
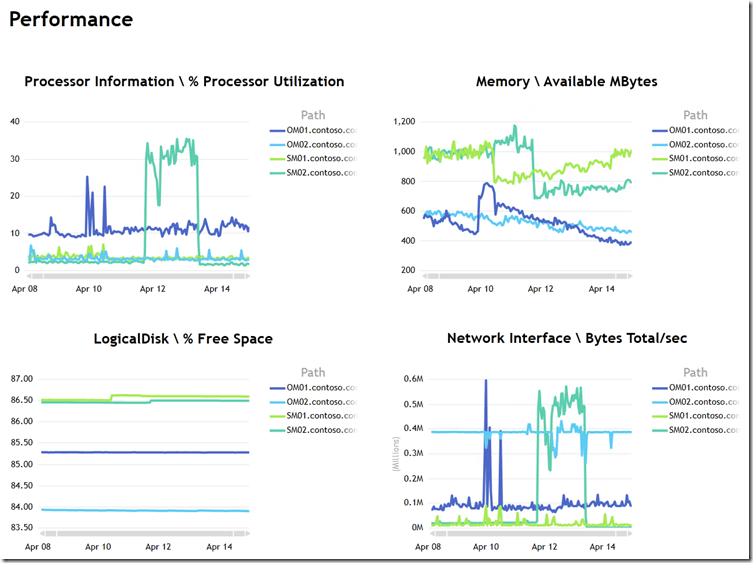
Here is an example where I filtered the view to look at four Windows servers to see general data for the past week. Each chart is filtered to a specific object and counter:
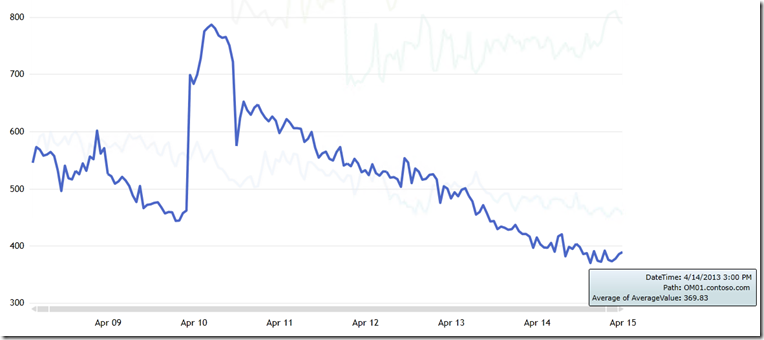
I can analyze the data, too. For instance, I popped out the Memory chart and highlighted a server in the legend. Then I hovered over a low point to get the time and value:
The SQL 2012 reporting services feature, Power View (http://technet.microsoft.com/en-us/library/hh213579.aspx), is included with Excel 2013. It provides quick and dynamic access to data from the SCOM Data Warehouse. This post describes how to setup Excel 2013 with a PowerPivot model and Power View reports using SCOM performance data.
Overview
A. Setup Excel 2013
B. Create a data source for the SCOM Data Warehouse
C. Add datasets
D. Create relationships
E. Make a view
Step by step
A. Setup Excel 2013
1. Install Excel 2013. I use the 64-bit version, because it can make use of more physical memory. Select File à Account à About Excel to check the bitness.
2. Load the add-ins for PowerPivot and Power View. Select File à Options à Add-Ins
3. Select COM Add-ins from the Manage: pulldown and click Go…
4. Check the boxes for Microsoft Office PowerPivot for Excel 2013 and Power View then click OK

5. Accept the prompts to install Silverlight if necessary.
B. Create a data source for the SCOM Data Warehouse
1. Click the POWERPIVOT tab
2. Then click Manage

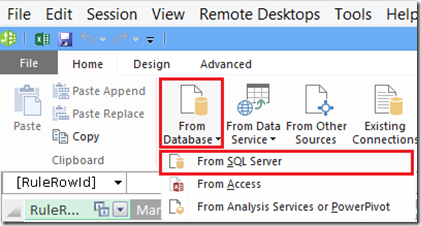
3. Select From Database then select From SQL Server from the pulldown
4. Enter a name like SCOM_DW in the Friendly connection name: field
5. Enter the SCOM Data Warehouse server name (with instance and port, if necessary) in the Server name: field
6. Select the name of the SCOM DW (OperationsManagerDW by default) from the Database name: pulldown
7. Click Next
8. On the How to Import the Data dialog select Write a query that will specify the data to import
9. Click Next
10. In the Friendly Query Name field type Perf Data
11. Copy and Paste in the following query (Simple Perf Queries):
SELECT PERF.ManagedEntityRowId
,PR.RuleRowId
,PERF.DateTime
,PERF.AverageValue
,PERF.MinValue
,PERF.MaxValue
,PERF.SampleCount
,PR.ObjectName
,PR.CounterName
,PRI.InstanceName
FROM Perf.vPerfHourly PERF
INNER JOIN vPerformanceRuleInstance PRI ON PRI.PerformanceRuleInstanceRowId = PERF.PerformanceRuleInstanceRowId
INNER JOIN vPerformanceRule PR ON PR.RuleRowId = PRI.RuleRowId
WHERE PERF.DateTime > (GETUTCDATE() – 7)
/*WHERE PERF.DateTime > (getutcdate() + 1) — Dummy condition to return no rows*/
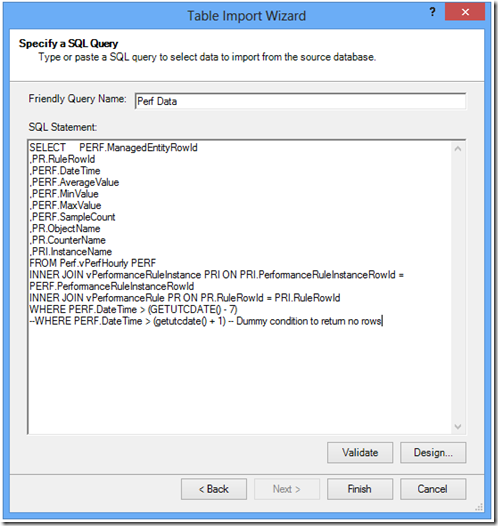
12. Click Finish
C. Add Additional datasets
1. Click Existing Connections in the Ribbon

2. Select SCOM_DW from the PowerPivot Data Connections
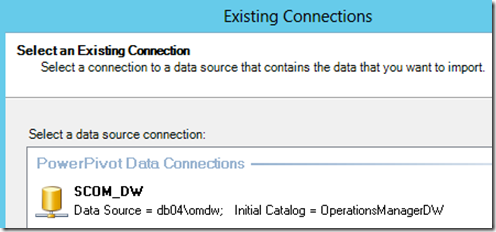
3. Click Open
4. Select Write a query that will specify the data to import and click Next >
5. In the Friendly Query Name type Perf Entities and Types
6. Copy and Paste in the following query:
select distinct
ME.ManagedEntityRowId
,ME.Name
,ME.DisplayName
,ME.Path
,MET.ManagedEntityTypeDefaultName
from Perf.vPerfHourly PERF
inner join vManagedEntity ME on ME.ManagedEntityRowId = PERF.ManagedEntityRowId
inner join vManagedEntityManagementGroup MEMG on MEMG.ManagedEntityRowId = ME.ManagedEntityRowId
inner join vManagedEntityType MET on MET.ManagedEntityTypeRowId = ME.ManagedEntityTypeRowId
where PERF.DateTime > (GETUTCDATE() – 7)
order by MET.ManagedEntityTypeDefaultName
7. Click Finish
8. Repeat steps 1-7 to create another dataset
9. Name it MPs and Rules
10. Use the following SQL Query:
SELECT distinct RU.RuleRowId
,MP.ManagementPackDefaultName
,MP.ManagementPackSystemName
,RU.RuleDefaultName
FROM vManagementPack MP
inner join vRule RU on RU.ManagementPackRowId = MP.ManagementPackRowId
inner join vPerformanceRule PR on PR.RuleRowId = RU.RuleRowId
where PR.LastReceivedDateTime > (GETUTCDATE() – 7)
D. Create relationships
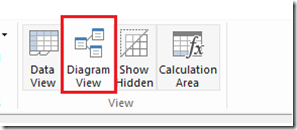
1. Click Diagram View in the Ribbon
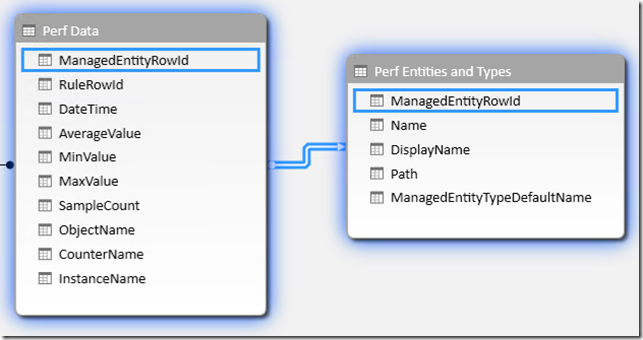
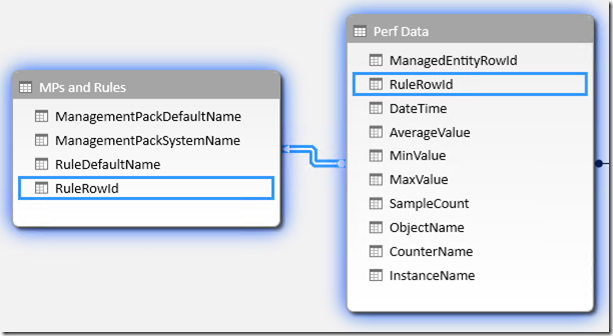
2. Click ManagedEntityRowID in the Perf Data dataset and drag a line to ManagedEntityRowID in the Perf Entities and Types dataset
3. Click RuleRowID in the Perf Data dataset and drag a line to RuleRowID in the MPs and Rules dataset
4. Close the PowerPivot window

E. Make a view
1. Click the INSERT menu
2. Click the Power View icon

3. Rename the tab to SCOM Perf

4. Expand the Perf Entities and Types dataset in the Power View Fields pane
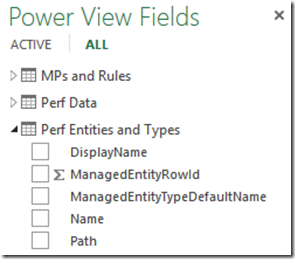
5. Drag the ManagedEntityTypeDefaultName to the Filters area

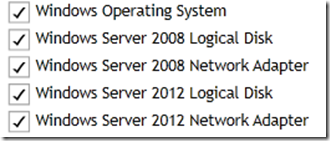
6. Check the boxes for managed entity types of interest
7. Expand the Perf Data dataset in the Power View Fields pane
8. Check the box for ObjectName
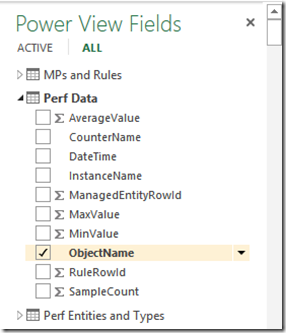
9. Click Slicer in the ribbon

10. Click in the empty space of the view to deselect the slicer
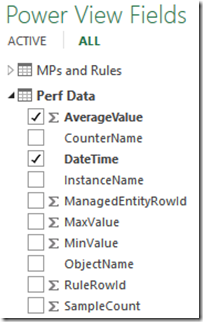
11. Check the boxes for AverageValue and DateTime in the Perf Data dataset
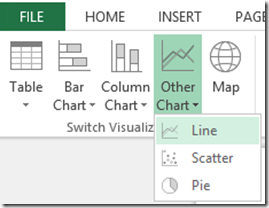
12. Select Other Chart à Line
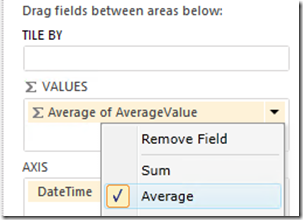
13. Change the AverageValue field to be averaged instead of summed
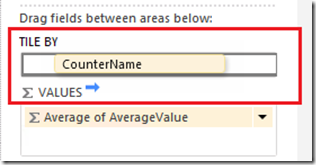
14. Drag CounterName into the TILE BY field
Note: The managed entity will determine the values for DisplayName, Name and Path. For top level entities, the path is null.
15. Select the chart
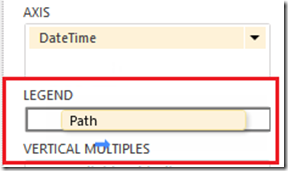
16. Drag the Path to the Legend
17. Save the workbook
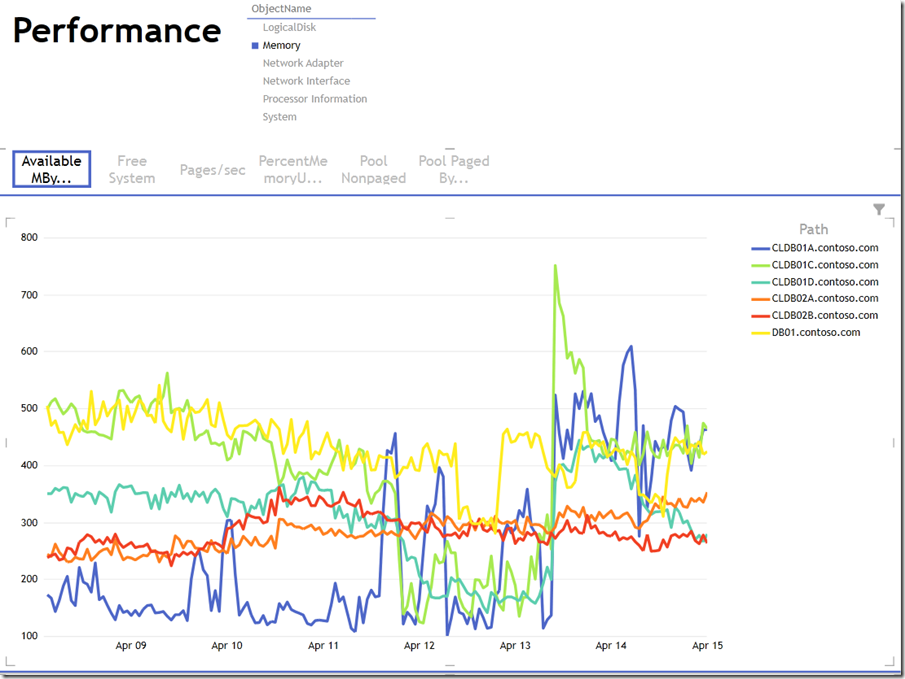
Here is my example:
Sample Files: https://www.scom2k7.com/downloads/PowerPivotExample.zip


![clip_image002[5] clip_image002[5]](https://www.scom2k7.com/wp-content/uploads/2013/03/clip_image0025_thumb.jpg)
