Russ Slaten is an MP authoring expert and that created a custom URL monitoring solution. This is my favorite solution as it addresses one of the most common issues that I have often heard from customers. “Don’t alert me if the website is down for only one second. Alert me if the website had be down for say five minutes”. The solution is a little more difficult to setup initially but once you have it working adding and removing website is as easy as updating an excel spreadsheet. You can even have the spreadsheet sit on a common file server so that people who have no clue how SCOM works can setup URL monitors.
I recommend installing this in your test lab first to get familiar with how it works.
So lets get started. First I download the Management Pack.
Custom.Example.WebsiteWatcher.zip
**Note an updated the solution since this post to target Resource Pools in SCOM 2012** Most of the configuration steps documented here still apply.
Download Updated MP Supporting Resouce pools: URLMonitoring.zip
I extract the files to see what’s in the zip file
There are two files in the zip package. The first one is the management pack. The second one is the CSV file for listing website to be monitored.
Now lets take a look at the management pack in MP Viewer
There are two classes. The Website class and the Website Watcher Class

There are two discoveries. One discovers which servers will be watcher nodes. The other discovers what website to monitor.

There are three monitors. One “monitors whether a website is up or down”. The second one “checks for a string in the response from an http request”. The third one “Monitors the Performance of a Website”. Seems easy enough

Also there is one relationship that ties the websites to the watcher nodes.

Let get this puppy installed.
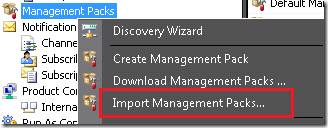
I open the administration console and go Management Packs. Right click and select Import Management Packs.
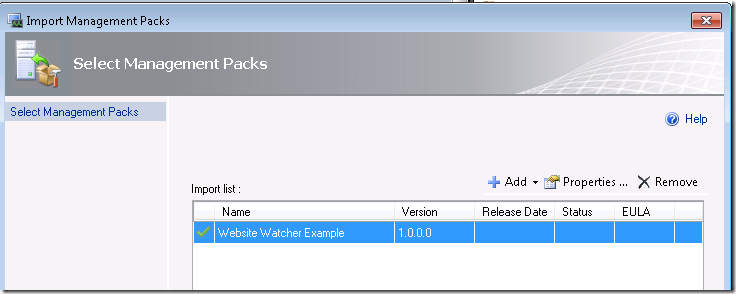
Then I go to Add and select Add from disk. Click no to search for dependencies.
Now I browse to the folder that I extracted the files to and select the “Custom.Example.WebsiteWatcher.xml” file
I click Install, and when its finished click Close
I have the Management Pack installed. Now I need to configure it for my environment. To keep it simple I am going to configure all my websites to be monitored from my RMS server. This way I can avoid messing with run as accounts.
First I am going to copy the CSV file to a simple location on the RMS. I created a folder on the RMS called c:\websitemonitoring and copied the “URLMonitoringList.csv” file there.
I open up the Operations Manager console and go to the Authoring Console and select Object Discoveries
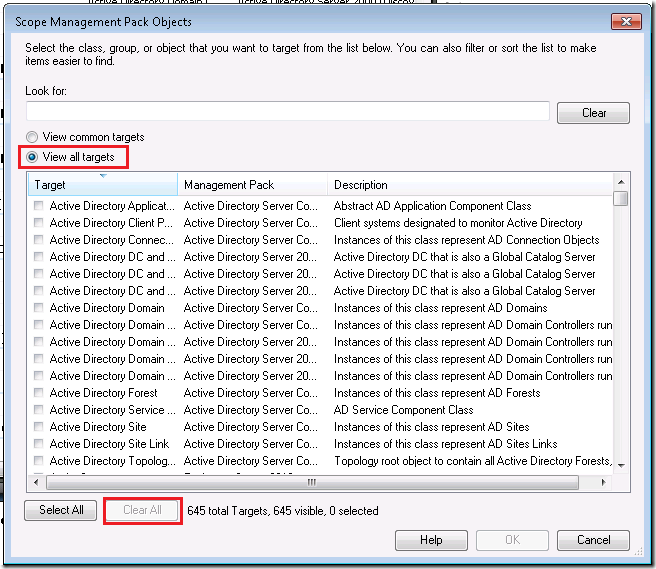
Now I need to change my scope
I select Clear All at the bottom and then select View all targets.
Now I type in Website Watcher and click Select All then ok
As I seen before with the MP Viewer tool there are two discoveries in this management pack
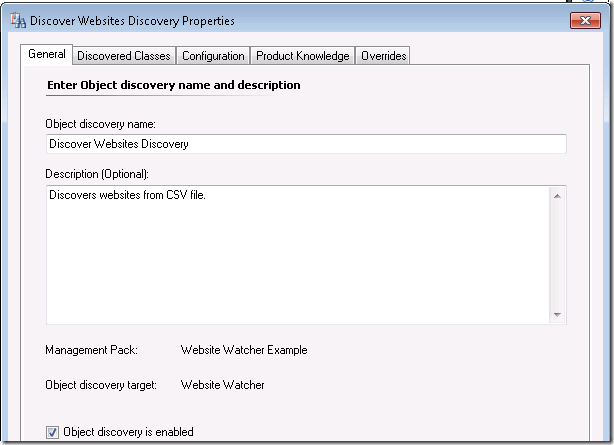
I double click on the Discover Websites Discovery
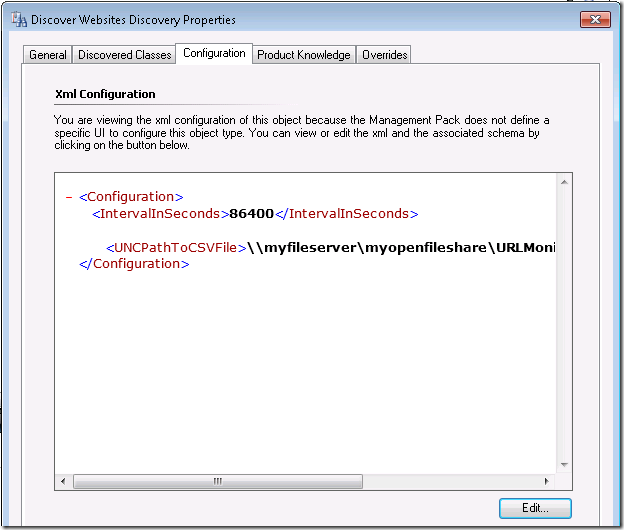
I go to the configuration tab and I can see the discovery contains an interval on how often websites are discovered and a path to the file.
I click the edit button and copy and paste the location of my URLMonitoringList.csv which is “C:\websitemonitoring\URLMonitoringList.csv”
I am also going to change the interval to every 300 seconds for testing purposes. Once I have my everything working I will change it back to one day or 86400 seconds
I click Ok and then Ok again.
Now I need to configure what server I will be monitoring the websites from. In this case I will just be using the RMS.
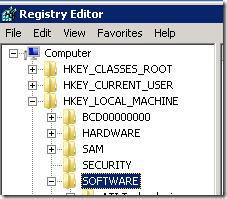
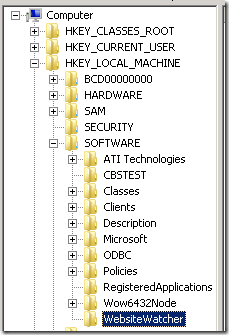
I remote desktop into into the RMS and create a registry Key (not value) in HKLM\Software called “WebsiteWatcher”
I go the registry by typing regedit
Navigate to HKEY_LOCALMACHINE\Software
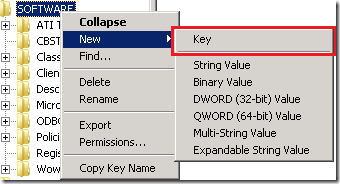
I right click and select New, Key
Then type in “WebsiteWatcher”
The discovery for this is set at once a day, while on the RMS I also cycled the System Center Management Services to speed up the discovery process. (I don’t recommend this in production)
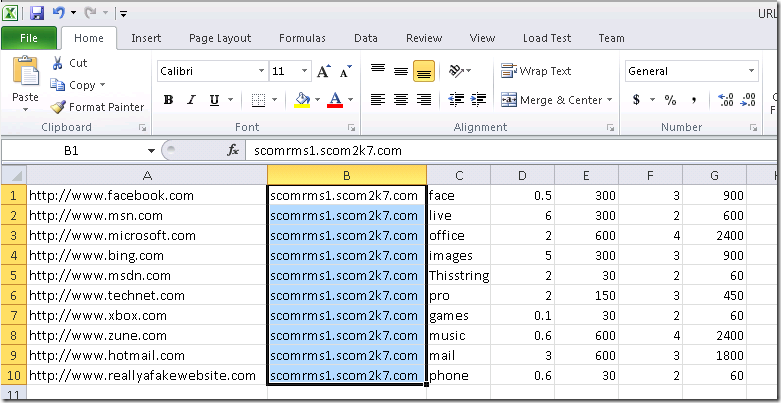
Now I need to open the URLMonitoringList.csv and edit with excel. I set second column to my RMS server and save it.
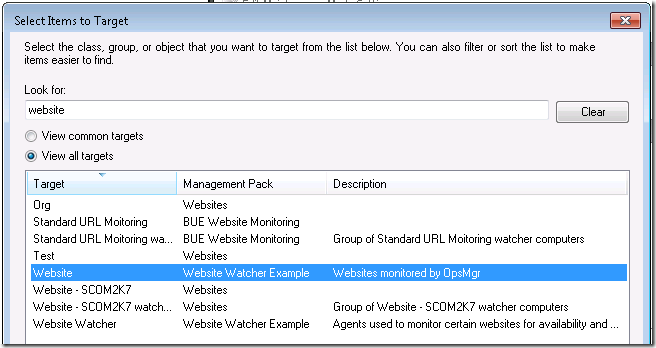
Now I go to the Monitoring console and go to the Discovered Inventory view and select View All target and type in website.
I can see all the website have been discovered and are now being monitored.









Hi Tim,
Thx very much for the complete details for each step.
Couple of questions if I may:
1. Can u pls show the steps for using different Watcher Nodes for a Website apart from the RMS?
2. Can Reports be generated for Availability using a Watcher Node availability report?
Cheers,
John Bradshaw
To change your watcher node.
Pick a different server in the discovery.
Change the excel document to use the same watcher node.
Copy the excel document to the new server. (Or you could leave it on the server and setup a run-as account and use a FQDN to it in the discovery)
Hi Tim,
I tried this solution and even tried the one from Russ.
Problem I am landing with is the content match.
Its not working.
I have 5 urls say, and for 1 of them i dont want to monitor content match, how can i do it.
Secondly i am not using a csv, i tried using XML for discoveries. do you think that is a problem.
seeking your help.
Thanks
Manish
If you don’t want to use content match just populate the field and then create an override to disable that monitor. As far as using an XML I’m sure there is as way to make that work as well.
Is there any way it can read complicated URLs like this one? I’ve tried it but its not getting the complicated URL, the simple URLs are ok.
http://shop.mercola.com/product/cla-120-capliques-per-bottle-1-bottle,77,10.htm
I don’t think it can handle complicated URLs like the one below. The simple URL are okay. Is there a workaround?
http://shop.mercola.com/product/krill-oil-capliques-180-per-bottle-1-bottle,665,18.htm
I think the problem is the CSV file, any workaround on the commas in the URL? I’ve tried double quotes they don’t work. Thank you.
Can we monitor a web site from any of watcher node by using proxy server
the pack created by opsconsole contains watcher group and website and it uses webapplication perspective data source discovery how do we go ahed and create custom discovery to discover watcher nodes based on this DS.
I am trying to reduce the efforts by writing web app monitoring in opsconsole and editing its xml as per my needs but seems it is taking more time than saving me some hours. 🙂
thanx
Could you explain what the fields in the CSV file means? What is Max Response time and what is the difference between Monitoring interval in seconds and Time Windows in seconds?
Max Response Time
Monitoring Interval in Seconds
Time Windows in Seconds
Attempts Before Turning Red
Thank You,
Brandon
The configuration settings that are possible in the CSV are as follows:
The URL you want to monitor (one row per instance)
The Watcher Node you want to monitor this URL
A string you want to look for on the website
The maximum response time that you find acceptable
How often you want to check this website (in seconds)
The number of times you want to check this website before turning the monitor critical
The time window in which you want to look for consecutive failures
Example: You check a website every 30 seconds. You want to alert if it is deemed “Slow”, ”Down”, or ”Missing Content” after 2 minutes. You would specify 30 seconds for your check interval, 4 for the number of times you want to check the site, and 120 seconds for your time window.
Please explain these
Max Response Time
Monitoring Intervals in Seconds
Time Windows in Seconds
The configuration settings that are possible in the CSV are as follows:
The URL you want to monitor (one row per instance)
The Watcher Node you want to monitor this URL
A string you want to look for on the website
The maximum response time that you find acceptable
How often you want to check this website (in seconds)
The number of times you want to check this website before turning the monitor critical
The time window in which you want to look for consecutive failures
Example: You check a website every 30 seconds. You want to alert if it is deemed “Slow”, ”Down”, or ”Missing Content” after 2 minutes. You would specify 30 seconds for your check interval, 4 for the number of times you want to check the site, and 120 seconds for your time window.
Thank you for the reply. I’m still confused on the Max Response Time. Is the Max Response Time in seconds or minutes?
My scenario is having the Management Pack check the site every 30 seconds. I want it to alert when it’s down after 2 minutes. Attempts before changing the alert to Red is 1.
Max Response Time……?
Monitoring Interval in Seconds….30
Time Windows in Seconds……..120
Attempts Before Turning Red…..1
Thank you
Testing on SCOM 2012. The content match and performance aspects of this MP do not seem to work. The availability wprks fine still.
I have inmplemented this solution in production SCOM . It is working fine , But it is broken web cosole
web site page is not opening
Thanks,
Kamal Sharma
Updated MP Links