One of my customers was experiencing lots of growth in their OperationsManager DB.
They monitor hundreds of SQL servers. I had a look into their Top Tables using Kevin Holman’s Large table query. http://bit.ly/1REx9Os
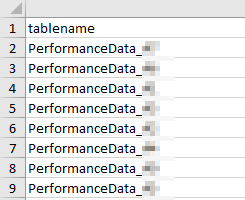
Things looked pretty normal where Performance tables are the top tables
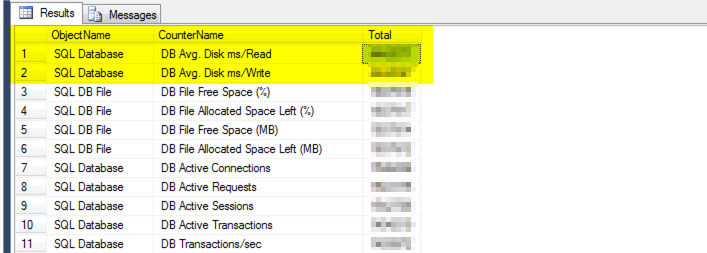
I drilled down a little further in the performance data and see this.
Focusing on the two top counters that are 4x larger then the next few.
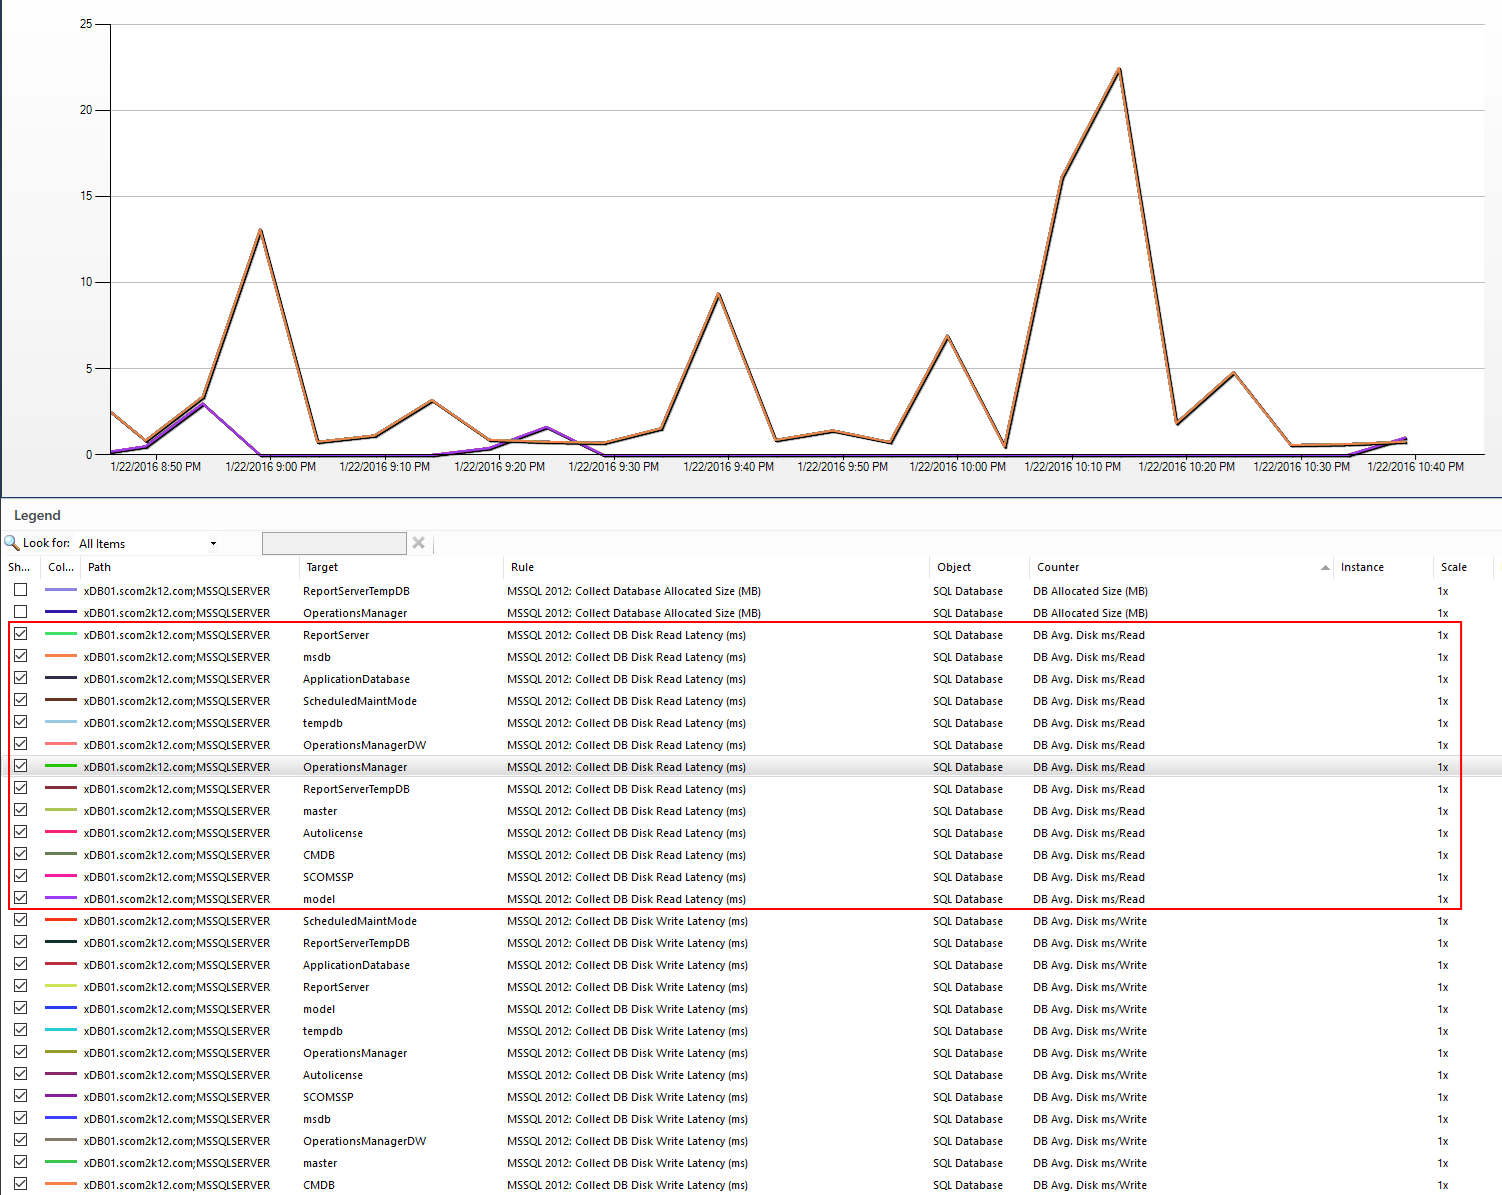
I took a look at the counters for one of my SQL servers and realize that we are collecting the same counter over and over for each database instance on a SQL server.
This is crazy. It might make some sense if a customer ran every database on a individual drive, but that is not the norm. Most SQL servers have one or a few drives for their DB files and Logs.
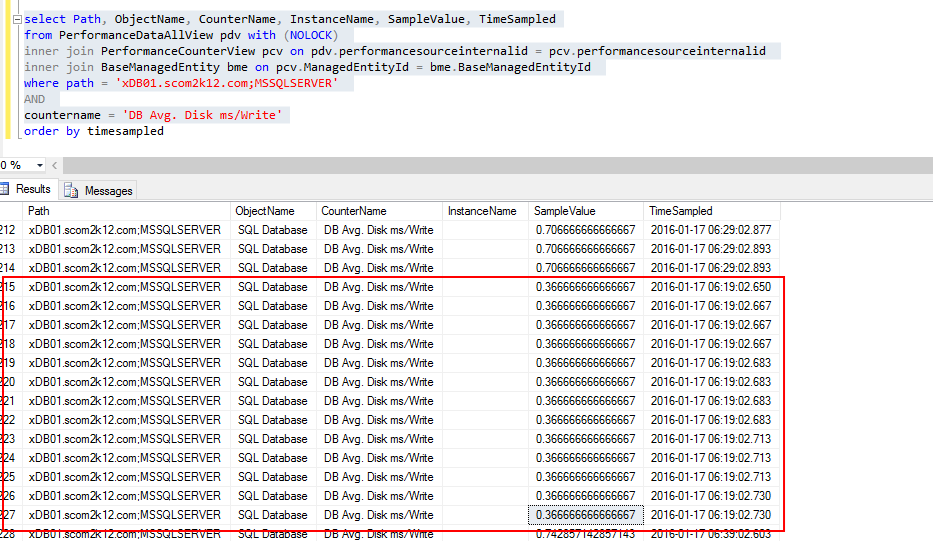
To double check I looked at the OperationsManager database performance tables.
Sure enough we are collecting the same data 13 times in my case.
So how do we fix this? Disable the rule that collects this data using an override for SQL 2005, 2008, 2012, and 2014.
Rule for SQL 2012 is called
- MSSQL 2012: Collect DB Disk Write Latency (ms)
- MSSQL 2012: Collect DB Disk Read Latency (ms)
I then recommend collecting this data if you need it once per disk.
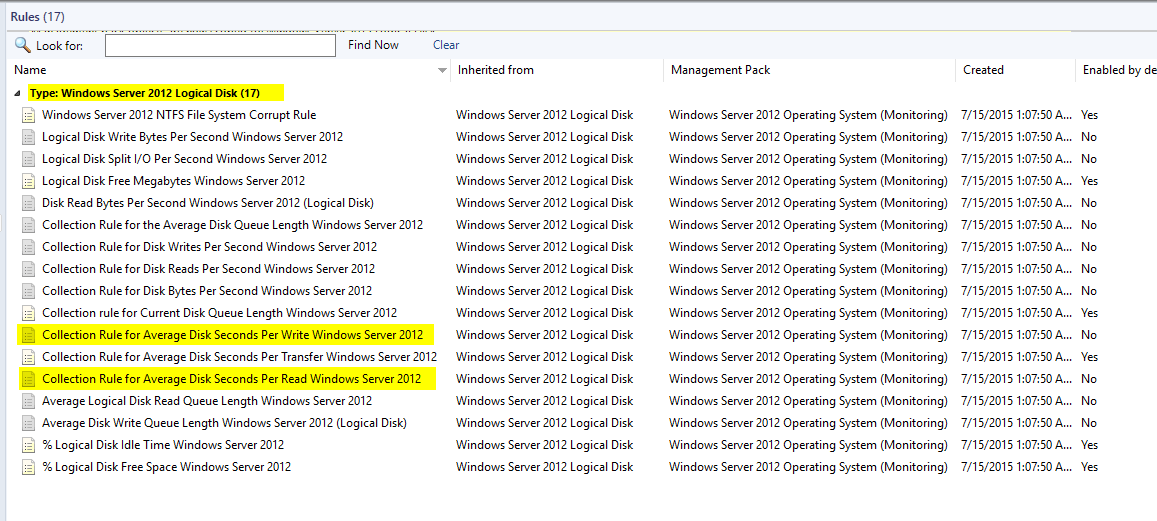
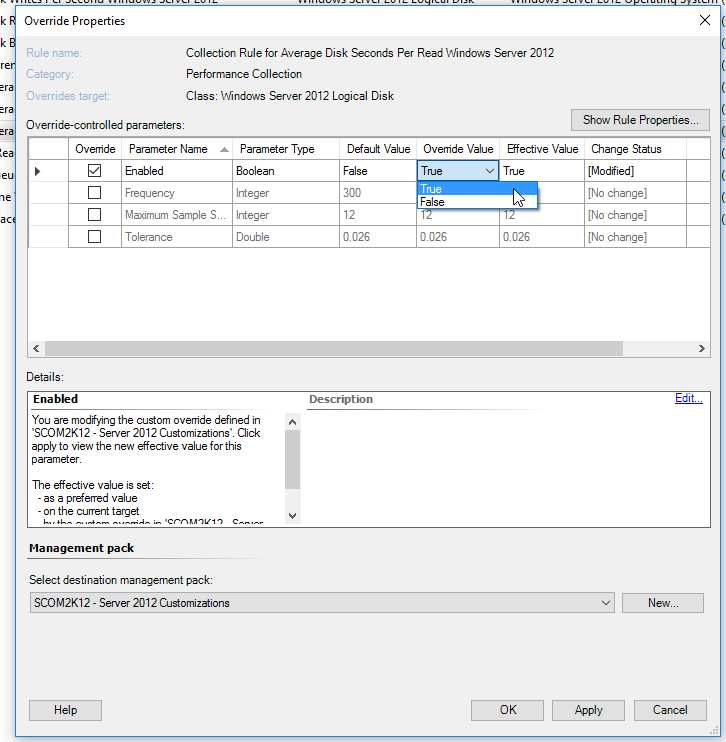
To enable it, create an override for Windows Server 2008 and 2012 Logical Disk
- Collection Rule for Average Disk Seconds Per Write Windows Server 2012
- Collection Rule for Average Disk Seconds Per Read Windows Server 2012



Awesome article!
I have servers with multiple instances with 50 plus databases per instance and all on the same drive.